
Clever Firm Predicts Patients Most at Risk, Then Tries to Intervene Before They Get Sicker
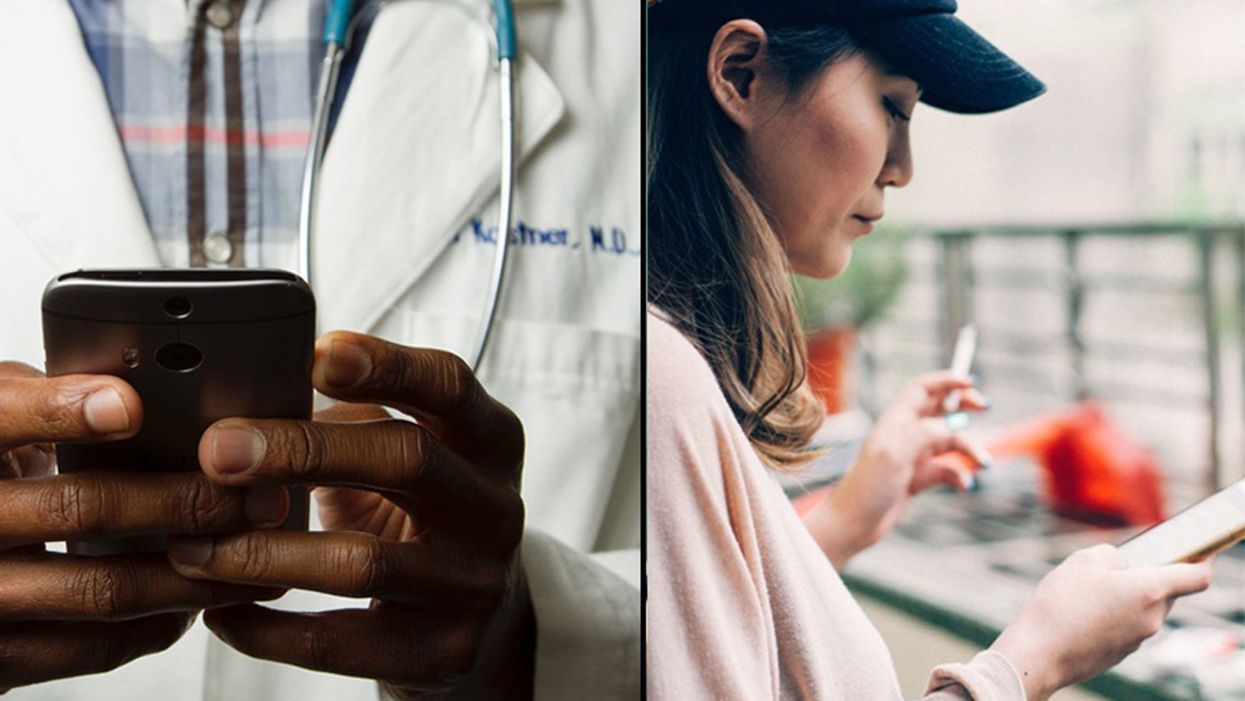
Health firm Populytics tracks and analyzes patient data, and makes care suggestions based on that data.
The diabetic patient hit the danger zone.
Ideally, blood sugar, measured by an A1C test, rests at 5.9 or less. A 7 is elevated, according to the Diabetes Council. Over 10, and you're into the extreme danger zone, at risk of every diabetic crisis from kidney failure to blindness.
In three months of working with a case manager, Jen's blood sugar had dropped to 7.2, a much safer range.
This patient's A1C was 10. Let's call her Jen for the sake of this story. (Although the facts of her case are real, the patient's actual name wasn't released due to privacy laws.).
Jen happens to live in Pennsylvania's Lehigh Valley, home of the nonprofit Lehigh Valley Health Network, which has eight hospital campuses and various clinics and other services. This network has invested more than $1 billion in IT infrastructure and founded Populytics, a spin-off firm that tracks and analyzes patient data, and makes care suggestions based on that data.
When Jen left the doctor's office, the Populytics data machine started churning, analyzing her data compared to a wealth of information about future likely hospital visits if she did not comply with recommendations, as well as the potential positive impacts of outreach and early intervention.
About a month after Jen received the dangerous blood test results, a community outreach specialist with psychological training called her. She was on a list generated by Populytics of follow-up patients to contact.
"It's a very gentle conversation," says Cathryn Kelly, who manages a care coordination team at Populytics. "The case manager provides them understanding and support and coaching." The goal, in this case, was small behavioral changes that would actually stick, like dietary ones.
In three months of working with a case manager, Jen's blood sugar had dropped to 7.2, a much safer range. The odds of her cycling back to the hospital ER or veering into kidney failure, or worse, had dropped significantly.
While the health network is extremely localized to one area of one state, using data to inform precise medical decision-making appears to be the wave of the future, says Ann Mongovern, the associate director of Health Care Ethics at the Markkula Center for Applied Ethics at Santa Clara University in California.
"Many hospitals and hospital systems don't yet try to do this at all, which is striking given where we're at in terms of our general technical ability in this society," Mongovern says.
How It Happened
While many hospitals make money by filling beds, the Lehigh Valley Health Network, as a nonprofit, accepts many patients on Medicaid and other government insurances that don't cover some of the costs of a hospitalization. The area's population is both poorer and older than national averages, according to the U.S. Census data, meaning more people with higher medical needs that may not have the support to care for themselves. They end up in the ER, or worse, again and again.
In the early 2000s, LVHN CEO Dr. Brian Nester started wondering if his health network could develop a way to predict who is most likely to land themselves a pricey ICU stay -- and offer support before those people end up needing serious care.
Embracing data use in such specific ways also brings up issues of data security and patient safety.
"There was an early understanding, even if you go back to the (federal) balanced budget act of 1997, that we were just kicking the can down the road to having a functional financial model to deliver healthcare to everyone with a reasonable price," Nester says. "We've got a lot of people living longer without more of an investment in the healthcare trust."
Popultyics, founded in 2013, was the result of years of planning and agonizing over those population numbers and cost concerns.
"We looked at our own health plan," Nester says. Out of all the employees and dependants on the LVHN's own insurance network, "roughly 1.5 percent of our 25,000 people — under 400 people — drove $30 million of our $130 million on insurance costs -- about 25 percent."
"You don't have to boil the ocean to take cost out of the system," he says. "You just have to focus on that 1.5%."
Take Jen, the diabetic patient. High blood sugar can lead to kidney failure, which can mean weekly expensive dialysis for 20 years. Investing in the data and staff to reach patients, he says, is "pennies compared to $100 bills."
For most doctors, "there's no awareness for providers to know who they should be seeing vs. who they are seeing. There's no incentive, because the incentive is to see as many patients as you can," he says.
To change that, first the LVHN invested in the popular medical management system, Epic. Then, they negotiated with the top 18 insurance companies that cover patients in the region to allow access to their patient care data, which means they have reams of patient history to feed the analytics machine in order to make predictions about outcomes. Nester admits not every hospital could do that -- with 52 percent of the market share, LVHN had a very strong negotiating position.
Third party services take that data and churn out analytics that feeds models and care management plans. All identifying information is stripped from the data.
"We can do predictive modeling in patients," says Populytics President and CEO Gregory Kile. "We can identify care gaps. Those care gaps are noted as alerts when the patient presents at the office."
Kile uses himself as a hypothetical patient.
"I pull up Gregory Kile, and boom, I see a flag or an alert. I see he hasn't been in for his last blood test. There is a care gap there we need to complete."
"There's just so much more you can do with that information," he says, envisioning a future where follow-up for, say, knee replacement surgery and outcomes could be tracked, and either validated or changed.
Ethical Issues at the Forefront
Of course, embracing data use in such specific ways also brings up issues of security and patient safety. For example, says medical ethicist Mongovern, there are many touchpoints where breaches could occur. The public has a growing awareness of how data used to personalize their experiences, such as social media analytics, can also be monetized and sold in ways that benefit a company, but not the user. That's not to say data supporting medical decisions is a bad thing, she says, just one with potential for public distrust if not handled thoughtfully.
"You're going to need to do this to stay competitive," she says. "But there's obviously big challenges, not the least of which is patient trust."
So far, a majority of the patients targeted – 62 percent -- appear to embrace the effort.
Among the ways the LVHN uses the data is monthly reports they call registries, which include patients who have just come in contact with the health network, either through the hospital or a doctor that works with them. The community outreach team members at Populytics take the names from the list, pull their records, and start calling. So far, a majority of the patients targeted – 62 percent -- appear to embrace the effort.
Says Nester: "Most of these are vulnerable people who are thrilled to have someone care about them. So they engage, and when a person engages in their care, they take their insulin shots. It's not rocket science. The rocket science is in identifying who the people are — the delivery of care is easy."
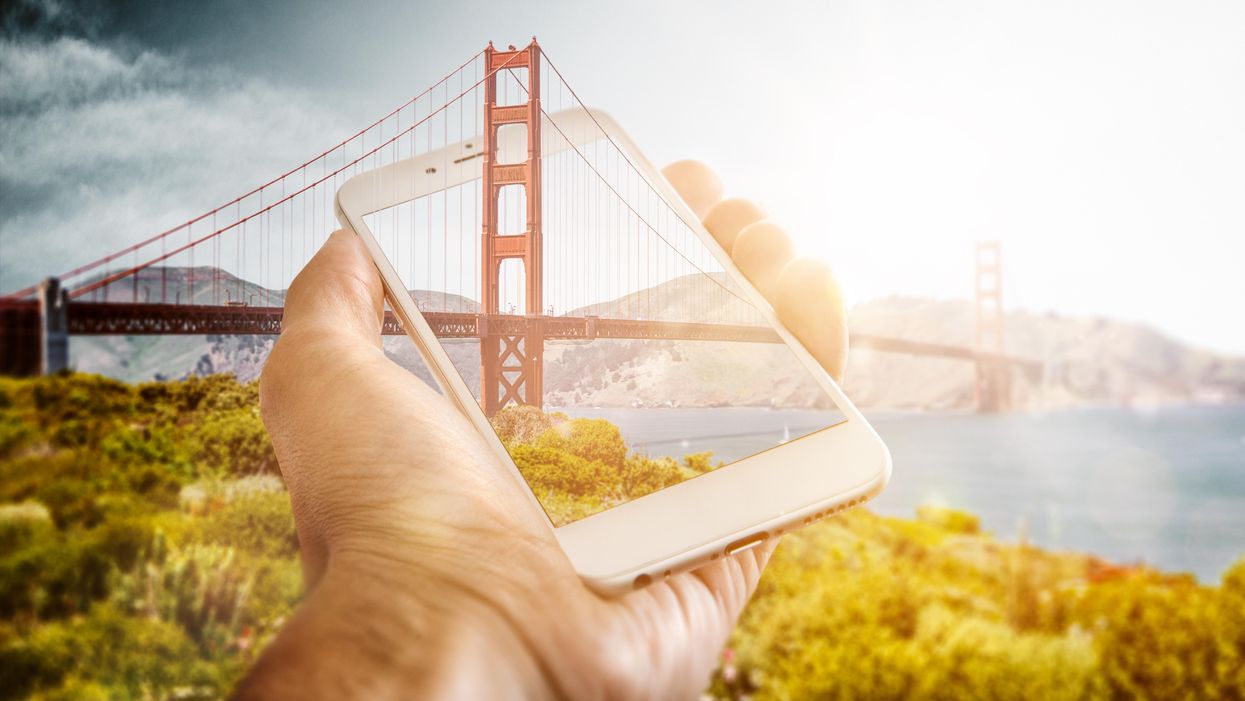
Your phone could show if a bridge is about to collapse
Researchers have tested a new smartphone app that could gather data about whether bridges are "structurally deficient" —a low-cost citizen-scientist alternative to current methods that are expensive and complex.
In summer 2017, Thomas Matarazzo, then a postdoctoral researcher at the Massachusetts Institute of Technology, landed in San Francisco with a colleague. They rented two cars, drove up to the Golden Gate bridge, timing it to the city’s rush hour, and rode over to the other side in heavy traffic. Once they reached the other end, they turned around and did it again. And again. And again.
“I drove over that bridge 100 times over five days, back and forth,” says Matarazzo, now an associate director of High-Performance Computing in the Center for Innovation in Engineering at the United States Military Academy, West Point. “It was surprisingly stressful, I never anticipated that. I had to maintain the speed of about 30 miles an hour when the speed limit is 45. I felt bad for everybody behind me.”
Matarazzo had to drive slowly because the quality of data they were collecting depended on it. The pair was designing and testing a new smartphone app that could gather data about the bridge’s structural integrity—a low-cost citizen-scientist alternative to the current industrial methods, which aren’t always possible, partly because they’re expensive and complex. In the era of aging infrastructure, when some bridges in the United States and other countries are structurally unsound to the point of collapsing, such an app could inform authorities about the need for urgent repairs, or at least prompt closing the most dangerous structures.
There are 619,588 bridges in the U.S., and some of them are very old. For example, the Benjamin Franklin Bridge connecting Philadelphia to Camden, N.J., is 96-years-old while the Brooklyn Bridge is 153. So it’s hardly surprising that many could use some upgrades. “In the U.S., a lot of them were built in the post-World War II period to accommodate the surge of motorization,” says Carlo Ratti, architect and engineer who directs the Senseable City Lab at Massachusetts Institute of Technology. “They are beginning to reach the end of their life.”
According to the 2022 American Road & Transportation Builders Association’s report, one in three U.S. bridges needs repair or replacement. The Department of Transportation (DOT) National Bridge Inventory (NBI) database reveals concerning numbers. Thirty-six percent of U.S. bridges need repair work and over 78,000 bridges should be replaced. More than 43,500 bridges are rated in poor condition and classified as “structurally deficient” – an alarming description. Yet, people drive over them 167.5 million times a day. The Pittsburgh bridge which collapsed in January this year—only hours before President Biden arrived to discuss the new infrastructure law—was on the “poor” rating list.
Assessing the structural integrity of a bridge is not an easy endeavor. Most of the time, these are visual inspections, Matarazzo explains. Engineers check cracks, rust and other signs of wear and tear. They also check for wildlife—birds which may build nests or even small animals that make homes inside the bridge structures, which can slowly chip at the structure. However, visual inspections may not tell the whole story. A more sophisticated and significantly more expensive inspection requires placing special sensors on the bridge that essentially listen to how the bridge vibrates.
“Some bridges can afford expensive sensors to do the job, but that comes at a very high cost—hundreds of thousands of dollars per bridge per year,” Ratti says.
We may think of bridges as immovable steel and concrete monoliths, but they naturally vibrate, oscillating slightly. That movement can be influenced by the traffic that passes over them, and even by wind. Bridges of different types vibrate differently—some have longer vibrational frequencies and others shorter ones. A good way to visualize this phenomenon is to place a ruler over the edge of a desk and flick it slightly. If the ruler protrudes far off the desk, it will vibrate slowly. But if you shorten the end that hangs off, it will vibrate much faster. It works similarly with bridges, except there are more factors at play, including not only the length, but also the design and the materials used.
The long suspension bridges such as the Golden Gate or Verrazano Narrows, which hang on a series of cables, are more flexible, and their vibration amplitudes are longer. The Golden Gate Bridge can vibrate at 0.106 Hertz, where one Hertz is one oscillation per second. “Think about standing on the bridge for about 10 seconds—that's how long it takes for it to move all the way up and all the way down in one oscillation,” Matarazzo says.
On the contrary, the concrete span bridges that rest on multiple columns like Brooklyn Bridge or Manhattan Bridge, are “stiffer” and have greater vibrational frequencies. A concrete bridge can have a frequency of 10 Hertz, moving 10 times in one second—like that shorter stretch of a ruler.
The special devices that can pick up and record these vibrations over time are called accelerometers. A network of these devices for each bridge can cost $20,000 to $50,000, and more—and require trained personnel to place them. The sensors also must stay on the bridge for some time to establish what’s a healthy vibrational baseline for a given bridge. Maintaining them adds to the cost. “Some bridges can afford expensive sensors to do the job, but that comes at a very high cost—hundreds of thousands of dollars per bridge per year,” Ratti says.
Making sense of the readouts they gather is another challenge, which requires a high level of technical expertise. “You generally need somebody, some type of expert capable of doing the analysis to translate that data into information,” says Matarazzo, which ticks up the price, so doing visual inspections often proves to be a more economical choice for state-level DOTs with tight budgets. “The existing systems work well, but have downsides,” Ratti says. The team thought the old method could use some modernizing.
Smartphones, which are carried by millions of people, contain dozens of sensors, including the accelerometers capable of picking up the bridges’ vibrations. That’s why Matarazzo and his colleague drove over the bridge 100 times—they were trying to pick up enough data. Timing it to rush hour supported that goal because traffic caused more “excitation,” Matarazzo explains. “Excitation is a big word we use when we talk about what drives the vibration,” he says. “When there's a lot of traffic, there's more excitation and more vibration.” They also collaborated with Uber, whose drivers made 72 trips across the bridge to gather data in different cars.
The next step was to clean the data from “noise”—various vibrations that weren’t relevant to the bridge but came from the cars themselves. “It could be jumps in speed, it could be potholes, it could be a bunch of other things," Matarazzo says. But as the team gathered more data, it became easier to tell the bridge vibrational frequencies from all others because the noises generated by cars, traffic and other things tend to “cancel out.”
The team specifically picked the Golden Gate bridge because the civil structural engineering community had studied it extensively over the years and collected a host of vibrational data, using traditional sensors. When the researchers compared their app-collected frequencies with those gathered by 240 accelerometers formerly placed on the Golden Gate, the results were the same—the data from the phones converged with that from the bridge’s sensors. The smartphone-collected data were just as good as those from industry devices.
The study authors estimate that officials could use crowdsourced data to make key improvements that would help new bridges to last about 14 years longer.
The team also tested their method on a different type of bridge—not a suspension one like the Golden Gate, but a concrete span bridge in Ciampino, Italy. There they compared 280 car trips over the bridge to the six sensors that had been placed on the bridge for seven months. The results were slightly less matching, but a larger volume of trips would fix the divergence, the researchers wrote in their study, titled Crowdsourcing bridge dynamic monitoring with smartphone vehicle trips, published last month in Nature Communications Engineering.
Although the smartphones proved effective, the app is not quite ready to be rolled out commercially for people to start using. “It is still a pilot version,” so there’s room for improvement, says Ratti, who co-authored the study. “But on a more optimistic note, it has really low barriers to entry—all you need is smartphones on cars—so that makes the system easy to reach a global audience.” And the study authors estimate that the use of crowdsourced data would result in a new bridge lasting about 14 years longer.
Matarazzo hopes that the app could be eventually accessible for your average citizen scientist to collect the data and supply it to their local transportation authorities. “I hope that this idea can spark a different type of relationship with infrastructure where people think about the data they're collecting as some type of contribution or investment into their communities,” he says. “So that they can help their own department of transportation, their own municipality to support that bridge and keep it maintained better, longer and safer.”
Lina Zeldovich has written about science, medicine and technology for Popular Science, Smithsonian, National Geographic, Scientific American, Reader’s Digest, the New York Times and other major national and international publications. A Columbia J-School alumna, she has won several awards for her stories, including the ASJA Crisis Coverage Award for Covid reporting, and has been a contributing editor at Nautilus Magazine. In 2021, Zeldovich released her first book, The Other Dark Matter, published by the University of Chicago Press, about the science and business of turning waste into wealth and health. You can find her on http://linazeldovich.com/ and @linazeldovich.
The Friday Five: Sugar could help catch cancer early
In this week's Friday Five, catching cancer early could depend on sugar, how to boost memory in a flash, a tiny sandwich cake could help the heart, and meet the top banana in the fight against Covid.
The Friday Five covers five stories in research that you may have missed this week. There are plenty of controversies and troubling ethical issues in science – and we get into many of them in our online magazine – but this news roundup focuses on scientific creativity and progress to give you a therapeutic dose of inspiration headed into the weekend.
Listen on Apple | Listen on Spotify | Listen on Stitcher | Listen on Amazon | Listen on Google
Here are the promising studies covered in this week's Friday Five:
- Catching cancer early could depend on sugar
- How to boost memory in a flash
- This is your brain on books
- A tiny sandwich cake could help the heart
- Meet the top banana for fighting Covid variants