To Make Science Engaging, We Need a Sesame Street for Adults
A new kind of television series could establish the baseline narratives for novel science like gene editing, quantum computing, or artificial intelligence.
This article is part of the magazine, "The Future of Science In America: The Election Issue," co-published by LeapsMag, the Aspen Institute Science & Society Program, and GOOD.
In the mid-1960s, a documentary producer in New York City wondered if the addictive jingles, clever visuals, slogans, and repetition of television ads—the ones that were captivating young children of the time—could be harnessed for good. Over the course of three months, she interviewed educators, psychologists, and artists, and the result was a bonanza of ideas.
Perhaps a new TV show could teach children letters and numbers in short animated sequences? Perhaps adults and children could read together with puppets providing comic relief and prompting interaction from the audience? And because it would be broadcast through a device already in almost every home, perhaps this show could reach across socioeconomic divides and close an early education gap?
Soon after Joan Ganz Cooney shared her landmark report, "The Potential Uses of Television in Preschool Education," in 1966, she was prototyping show ideas, attracting funding from The Carnegie Corporation, The Ford Foundation, and The Corporation for Public Broadcasting, and co-founding the Children's Television Workshop with psychologist Lloyd Morrisett. And then, on November 10, 1969, informal learning was transformed forever with the premiere of Sesame Street on public television.
For its first season, Sesame Street won three Emmy Awards and a Peabody Award. Its star, Big Bird, landed on the cover of Time Magazine, which called the show "TV's gift to children." Fifty years later, it's hard to imagine an approach to informal preschool learning that isn't Sesame Street.
And that approach can be boiled down to one word: Entertainment.
Despite decades of evidence from Sesame Street—one of the most studied television shows of all time—and more research from social science, psychology, and media communications, we haven't yet taken Ganz Cooney's concepts to heart in educating adults. Adults have news programs and documentaries and educational YouTube channels, but no Sesame Street. So why don't we? Here's how we can design a new kind of television to make science engaging and accessible for a public that is all too often intimidated by it.
We have to start from the realization that America is a nation of high-school graduates. By the end of high school, students have decided to abandon science because they think it's too difficult, and as a nation, we've made it acceptable for any one of us to say "I'm not good at science" and offload thinking to the ones who might be. So, is it surprising that a large number of Americans are likely to believe in conspiracy theories like the 25% that believe the release of COVID-19 was planned, the one in ten who believe the Moon landing was a hoax, or the 30–40% that think the condensation trails of planes are actually nefarious chemtrails? If we're meeting people where they are, the aim can't be to get the audience from an A to an A+, but from an F to a D, and without judgment of where they are starting from.
There's also a natural compulsion for a well-meaning educator to fill a literacy gap with a barrage of information, but this is what I call "factsplaining," and we know it doesn't work. And worse, it can backfire. In one study from 2014, parents were provided with factual information about vaccine safety, and it was the group that was already the most averse to vaccines that uniquely became even more averse.
Why? Our social identities and cognitive biases are stubborn gatekeepers when it comes to processing new information. We filter ideas through pre-existing beliefs—our values, our religions, our political ideologies. Incongruent ideas are rejected. Congruent ideas, no matter how absurd, are allowed through. We hear what we want to hear, and then our brains justify the input by creating narratives that preserve our identities. Even when we have all the facts, we can use them to support any worldview.
But social science has revealed many mechanisms for hijacking these processes through narrative storytelling, and this can form the foundation of a new kind of educational television.
Could new television series establish the baseline narratives for novel science like gene editing, quantum computing, or artificial intelligence?
As media creators, we can reject factsplaining and instead construct entertaining narratives that disrupt cognitive processes. Two-decade-old research tells us when people are immersed in entertaining fiction narratives, they loosen their defenses, opening a path for new information, editing attitudes, and inspiring new behavior. Where news about hot-button issues like climate change or vaccination might trigger resistance or a backfire effect, fiction can be crafted to be absorbing and, as a result, persuasive.
But the narratives can't be stuffed with information. They must be simplified. If this feels like the opposite of what an educator should be doing, it is possible to reduce the complexity of information, without oversimplification, through "exemplification," a framing device to tell the stories of individuals in specific circumstances that can speak to the greater issue without needing to explain it all. It's a technique you've seen used in biopics. The Discovery Channel true-crime miniseries Manhunt: Unabomber does many things well from a science storytelling perspective, including exemplifying the virtues of the scientific method through a character who argues for a new field of science, forensic linguistics, to catch one of the most notorious domestic terrorists in U.S. history.
We must also appeal to the audience's curiosity. We know curiosity is such a strong driver of human behavior that it can even counteract the biases put up by one's political ideology around subjects like climate change. If we treat science information like a product—and we should—advertising research tells us we can maximize curiosity though a Goldilocks effect. If the information is too complex, your show might as well be a PowerPoint presentation. If it's too simple, it's Sesame Street. There's a sweet spot for creating intrigue about new information when there's a moderate cognitive gap.
The science of "identification" tells us that the more the main character is endearing to a viewer, the more likely the viewer will adopt the character's worldview and journey of change. This insight further provides incentives to craft characters reflective of our audiences. If we accept our biases for what they are, we can understand why the messenger becomes more important than the message, because, without an appropriate messenger, the message becomes faint and ineffective. And research confirms that the stereotype-busting doctor-skeptic Dana Scully of The X-Files, a popular science-fiction series, was an inspiration for a generation of women who pursued science careers.
With these directions, we can start making a new kind of television. But is television itself still the right delivery medium? Americans do spend six hours per day—a quarter of their lives—watching video. And even with the rise of social media and apps, science-themed television shows remain popular, with four out of five adults reporting that they watch shows about science at least sometimes. CBS's The Big Bang Theory was the most-watched show on television in the 2017–2018 season, and Cartoon Network's Rick & Morty is the most popular comedy series among millennials. And medical and forensic dramas continue to be broadcast staples. So yes, it's as true today as it was in the 1980s when George Gerbner, the "cultivation theory" researcher who studied the long-term impacts of television images, wrote, "a single episode on primetime television can reach more people than all science and technology promotional efforts put together."
We know from cultivation theory that media images can shape our views of scientists. Quick, picture a scientist! Was it an old, white man with wild hair in a lab coat? If most Americans don't encounter research science firsthand, it's media that dictates how we perceive science and scientists. Characters like Sheldon Cooper and Rick Sanchez become the model. But we can correct that by representing professionals more accurately on-screen and writing characters more like Dana Scully.
Could new television series establish the baseline narratives for novel science like gene editing, quantum computing, or artificial intelligence? Or could new series counter the misinfodemics surrounding COVID-19 and vaccines through more compelling, corrective narratives? Social science has given us a blueprint suggesting they could. Binge-watching a show like the surreal NBC sitcom The Good Place doesn't replace a Ph.D. in philosophy, but its use of humor plants the seed of continued interest in a new subject. The goal of persuasive entertainment isn't to replace formal education, but it can inspire, shift attitudes, increase confidence in the knowledge of complex issues, and otherwise prime viewers for continued learning.
[Editor's Note: To read other articles in this special magazine issue, visit the beautifully designed e-reader version.]
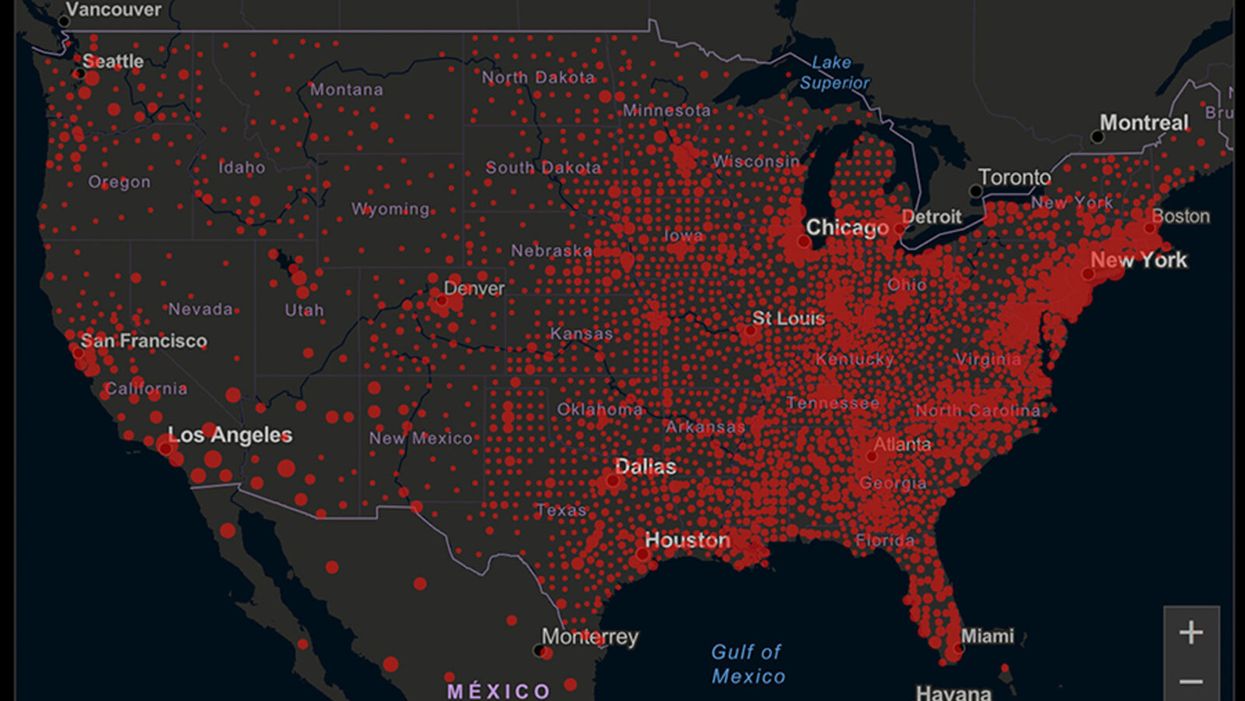
A map of cumulative known cases of COVID-19 in the U.S., as of June 12th, 2020.
Have you felt a bit like an armchair epidemiologist lately? Maybe you've been poring over coronavirus statistics on your county health department's website or on the pages of your local newspaper.
If the percentage of positive tests steadily stays under 8 percent, that's generally a good sign.
You're likely to find numbers and charts but little guidance about how to interpret them, let alone use them to make day-to-day decisions about pandemic safety precautions.
Enter the gurus. We asked several experts to provide guidance for laypeople about how to navigate the numbers. Here's a look at several common COVID-19 statistics along with tips about how to understand them.
Case Counts: Consider the Context
The number of confirmed COVID-19 cases in American counties is widely available. Local and state health departments should provide them online, or you can easily look them up at The New York Times' coronavirus database. However, you need to be cautious about interpreting them.
"Case counts are the obvious numbers to look at. But they're probably the hardest thing to sort out," said Dr. Jeff Martin, an epidemiologist at the University of California at San Francisco.
That's because case counts by themselves aren't a good window into how the coronavirus is affecting your community since they rely on testing. And testing itself varies widely from day to day and community to community.
"The more testing that's done, the more infections you'll pick up," explained Dr. F. Perry Wilson, a physician at Yale University. The numbers can also be thrown off when tests are limited to certain groups of people.
"If the tests are being mostly given to people with a high probability of having been infected -- for example, they have had symptoms or work in a high-risk setting -- then we expect lots of the tests to be positive. But that doesn't tell us what proportion of the general public is likely to have been infected," said Eleanor Murray, an epidemiologist at Boston University.
These Stats Are More Meaningful
According to Dr. Wilson, it's more useful to keep two other statistics in mind: the number of COVID tests that are being performed in your community and the percentage that turn up positive, showing that people have the disease. (These numbers may or may not be available locally. Check the websites of your community's health department and local news media outlets.)
If the number of people being tested is going up, but the percentage of positive tests is going down, Dr. Wilson said, that's a good sign. But if both numbers are going up – the number of people tested and the percentage of positive results – then "that's a sign that there are more infections burning in the community."
It's especially worrisome if the percentage of positive cases is growing compared to previous days or weeks, he said. According to him, that's a warning of a "high-risk situation."
Dr. George Rutherford, an epidemiologist at University of California at San Francisco, offered this tip: If the percentage of positive tests steadily stays under 8 percent, that's generally a good sign.
There's one more caveat about case counts. It takes an average of a week for someone to be infected with COVID-19, develop symptoms, and get tested, Dr. Rutherford said. It can take an additional several days for those test results to be reported to the county health department. This means that case numbers don't represent infections happening right now, but instead are a picture of the state of the pandemic more than a week ago.
Hospitalizations: Focus on Current Statistics
You should be able to find numbers about how many people in your community are currently hospitalized – or have been hospitalized – with diagnoses of COVID-19. But experts say these numbers aren't especially revealing unless you're able to see the number of new hospitalizations over time and track whether they're rising or falling. This number often isn't publicly available, however.
If new hospitalizations are increasing, "you may want to react by being more careful yourself."
And there's an important caveat: "The problem with hospitalizations is that they do lag," UC San Francisco's Dr. Martin said, since it takes time for someone to become ill enough to need to be hospitalized. "They tell you how much virus was being transmitted in your community 2 or 2.5 weeks ago."
Also, he said, people should be cautious about comparing new hospitalization rates between communities unless they're adjusted to account for the number of more-vulnerable older people.
Still, if new hospitalizations are increasing, he said, "you may want to react by being more careful yourself."
Deaths: They're an Even More Delayed Headline
Cable news networks obsessively track the number of coronavirus deaths nationwide, and death counts for every county in the country are available online. Local health departments and media websites may provide charts tracking the growth in deaths over time in your community.
But while death rates offer insight into the disease's horrific toll, they're not useful as an instant snapshot of the pandemic in your community because severely ill patients are typically sick for weeks. Instead, think of them as a delayed headline.
"These numbers don't tell you what's happening today. They tell you how much virus was being transmitted 3-4 weeks ago," Dr. Martin said.
'Reproduction Value': It May Be Revealing
You're not likely to find an available "reproduction value" for your community, but it is available for your state and may be useful.
A reproduction value, also known as R0 or R-naught, "tells us how many people on average we expect will be infected from a single case if we don't take any measures to intervene and if no one has been infected before," said Boston University's Murray.
As The New York Times explained, "R0 is messier than it might look. It is built on hard science, forensic investigation, complex mathematical models — and often a good deal of guesswork. It can vary radically from place to place and day to day, pushed up or down by local conditions and human behavior."
It may be impossible to find the R0 for your community. However, a website created by data specialists is providing updated estimates of a related number -- effective reproduction number, or Rt – for each state. (The R0 refers to how infectious the disease is in general and if precautions aren't taken. The Rt measures its infectiousness at a specific time – the "t" in Rt.) The site is at rt.live.
"The main thing to look at is whether the number is bigger than 1, meaning the outbreak is currently growing in your area, or smaller than 1, meaning the outbreak is currently decreasing in your area," Murray said. "It's also important to remember that this number depends on the prevention measures your community is taking. If the Rt is estimated to be 0.9 in your area and you are currently under lockdown, then to keep it below 1 you may need to remain under lockdown. Relaxing the lockdown could mean that Rt increases above 1 again."
"Whether they're on the upswing or downswing, no state is safe enough to ignore the precautions about mask wearing and social distancing."
Keep in mind that you can still become infected even if an outbreak in your community appears to be slowing. Low risk doesn't mean no risk.
Putting It All Together: Why the Numbers Matter
So you've reviewed COVID-19 statistics in your community. Now what?
Dr. Wilson suggests using the data to remind yourself that the coronavirus pandemic "is still out there. You need to take it seriously and continue precautions," he said. "Whether they're on the upswing or downswing, no state is safe enough to ignore the precautions about mask wearing and social distancing. 'My state is doing well, no one I know is sick, is it time to have a dinner party?' No."
He also recommends that laypeople avoid tracking COVID-19 statistics every day. "Check in once a week or twice a month to see how things are going," he suggested. "Don't stress too much. Just let it remind you to put that mask on before you get out of your car [and are around others]."
GOOD10: The Pandemic Issue explores big-picture ways that science innovation and communication can usher in a more equitable, more progress-oriented, and safer world.
This issue is a collaboration among GOOD, leapsmag, and the Aspen Institute Science & Society Program.
The GOOD10 format explores fundamental issues facing humanity through the lenses of ten forces pushing the needle toward progress: Places, Philanthropists, Celebrities, Whistleblowers, Companies, Media, Products, Politicians, Scientists, and Actions. Across these categories, we seek to present unexpected and encouraging paradigms emerging from this historic crisis.
This special issue is available as an e-reader version for both desktop and mobile. It is also available as a free downloadable PDF.
TABLE OF CONTENTS:
- PLACES:
55 Lessons Learned About Science Communication Around the World; Quarantining Our Way Into Outer Space - PLACES:
Quarantining Our Way Into Outer Space - PHILANTHROPISTS:
An Exclusive Interview with Wendy Schmidt about Science in the Pandemic Era - CELEBRITIES:
Neil deGrasse Tyson Wants Celebrities to Promote Scientists - WHISTLEBLOWERS:
The Science Sleuths Holding Fraudulent Research Accountable - COMPANIES:
The Biggest Challenge for a COVID-19 Vaccine: Making It Accessible and Affordable - MEDIA:
Isaac Asimov on the History of Infectious Disease—And How Humanity Learned To Fight Back - PRODUCTS:
Will COVID-19 Pave the Way For DIY Precision Medicine? - POLITICIANS:
Will the Pandemic Propel STEM Experts to Political Power? - SCIENTISTS:
Would a Broad-Spectrum Antiviral Drug Stop the Pandemic? - ACTIONS:
Pseudoscience is Rampant: How Not to Fall For It - ACTIONS:
How COVID-19 Could Usher In a New Age of Collective Drug Discovery
THE EVENT:
"The Pandemic Science Summit" focused on how science innovation is key to society's future stability as we emerge from the pandemic, featuring:
Christopher Bailey – Arts and Health Lead, World Health Organization
Elisabeth Bik, Ph.D. – Microbiologist and scientific integrity consultant
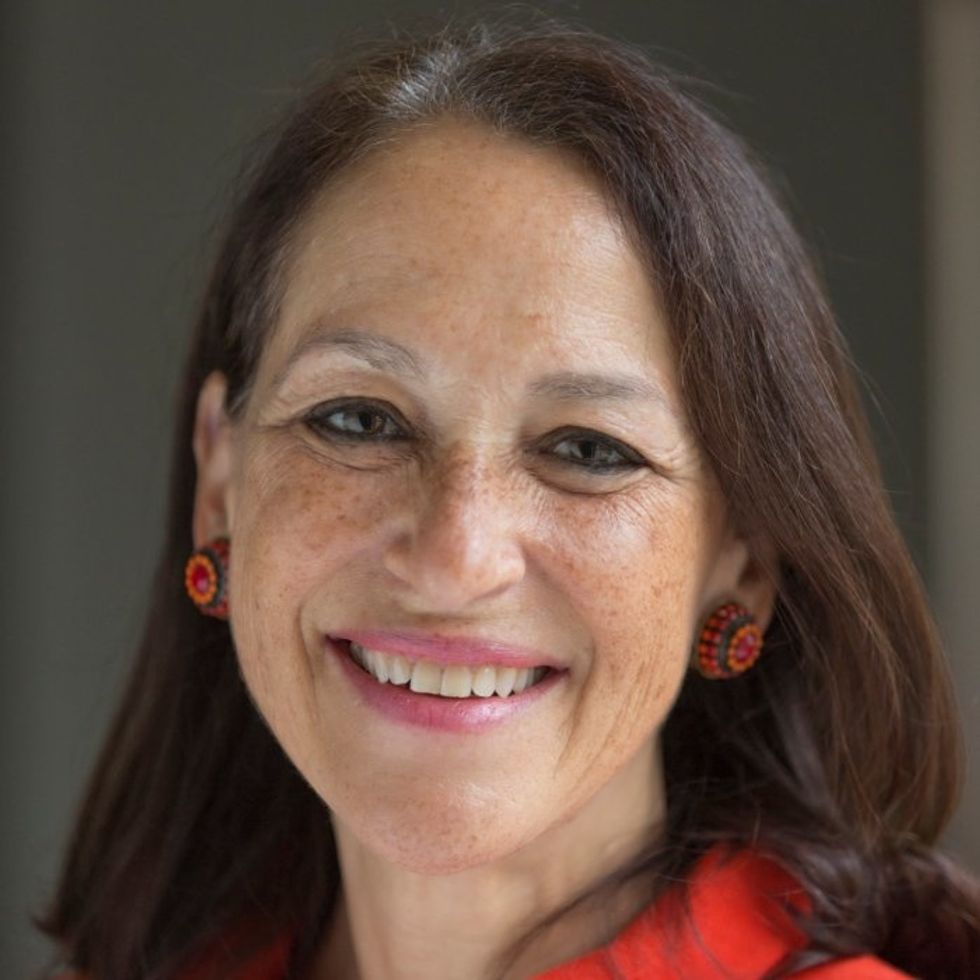
Margaret Hamburg, M.D. – Foreign Secretary, National Academy of Medicine; former Commissioner, U.S. Food and Drug Administration
Peggy Oti-Boateng, Ph.D. – Director, Division of Science Policy and Capacity- Building, UNESCO
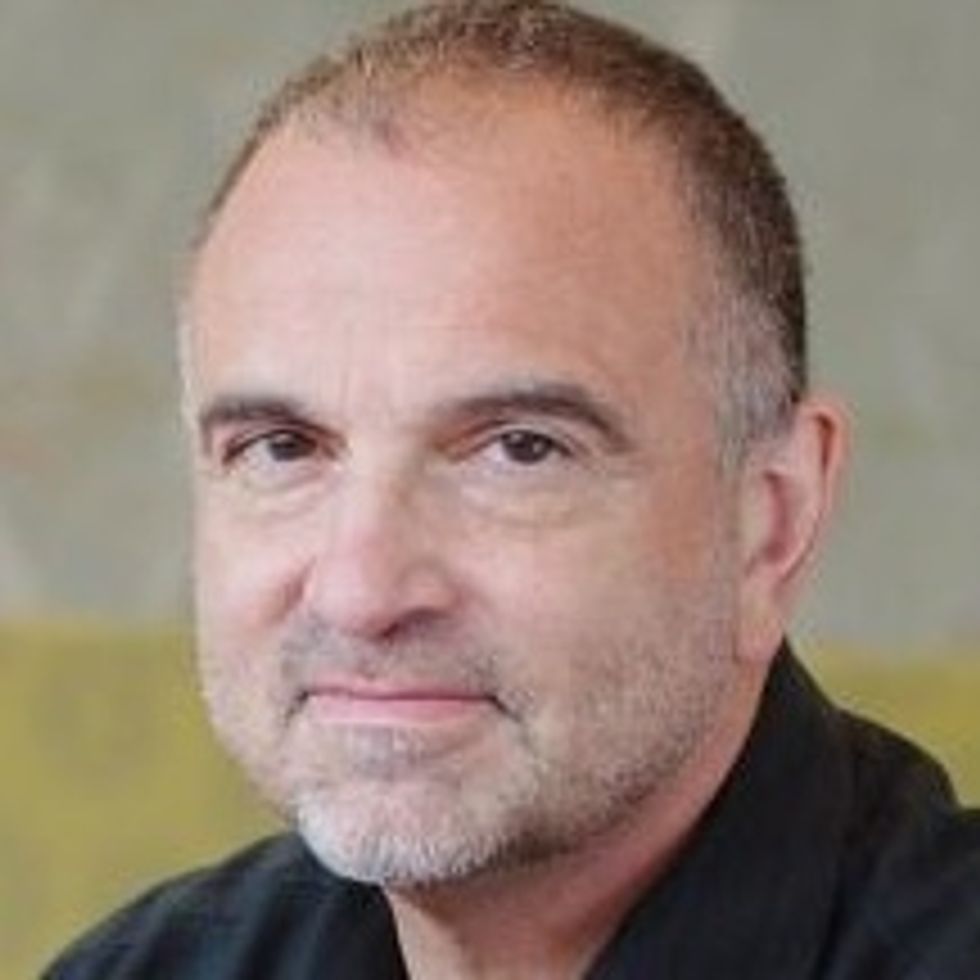
George Yancopoulos, M.D., Ph.D. – President and Chief Scientific Officer, Regeneron Pharmaceuticals
Kira Peikoff was the editor-in-chief of Leaps.org from 2017 to 2021. As a journalist, her work has appeared in The New York Times, Newsweek, Nautilus, Popular Mechanics, The New York Academy of Sciences, and other outlets. She is also the author of four suspense novels that explore controversial issues arising from scientific innovation: Living Proof, No Time to Die, Die Again Tomorrow, and Mother Knows Best. Peikoff holds a B.A. in Journalism from New York University and an M.S. in Bioethics from Columbia University. She lives in New Jersey with her husband and two young sons. Follow her on Twitter @KiraPeikoff.
