Your Community and COVID-19: How to Make Sense of the Numbers Where You Live
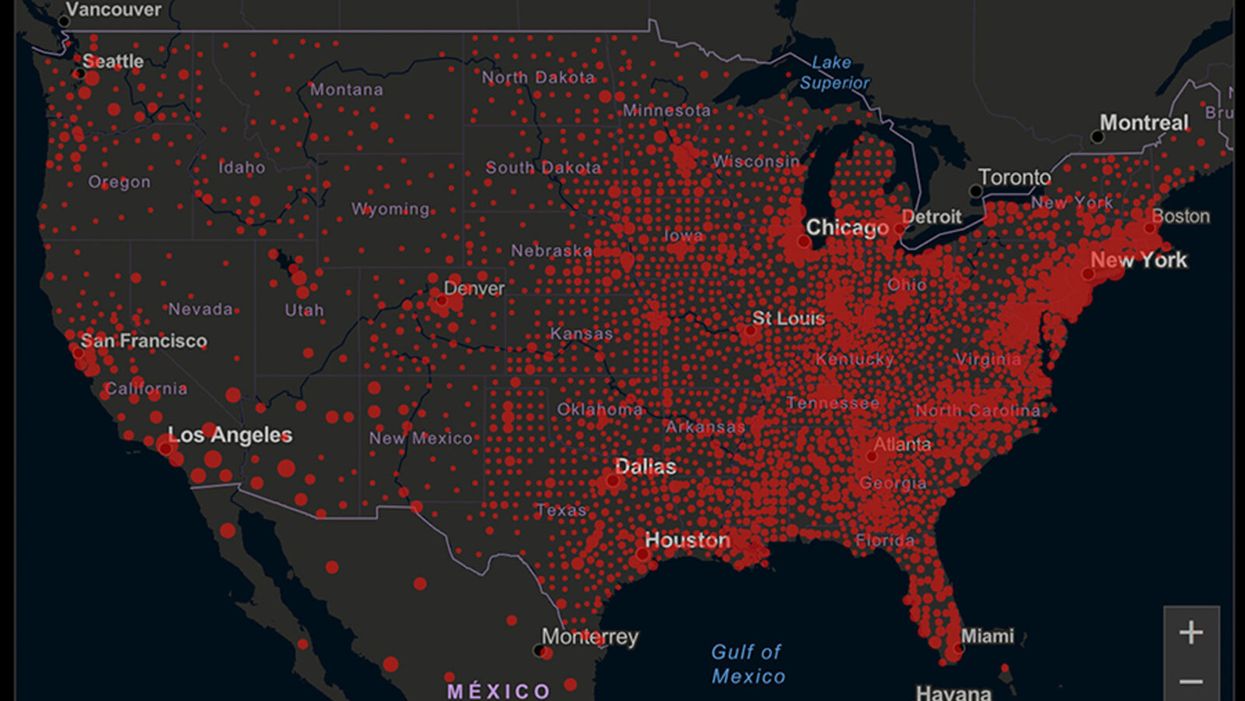
A map of cumulative known cases of COVID-19 in the U.S., as of June 12th, 2020.
Have you felt a bit like an armchair epidemiologist lately? Maybe you've been poring over coronavirus statistics on your county health department's website or on the pages of your local newspaper.
If the percentage of positive tests steadily stays under 8 percent, that's generally a good sign.
You're likely to find numbers and charts but little guidance about how to interpret them, let alone use them to make day-to-day decisions about pandemic safety precautions.
Enter the gurus. We asked several experts to provide guidance for laypeople about how to navigate the numbers. Here's a look at several common COVID-19 statistics along with tips about how to understand them.
Case Counts: Consider the Context
The number of confirmed COVID-19 cases in American counties is widely available. Local and state health departments should provide them online, or you can easily look them up at The New York Times' coronavirus database. However, you need to be cautious about interpreting them.
"Case counts are the obvious numbers to look at. But they're probably the hardest thing to sort out," said Dr. Jeff Martin, an epidemiologist at the University of California at San Francisco.
That's because case counts by themselves aren't a good window into how the coronavirus is affecting your community since they rely on testing. And testing itself varies widely from day to day and community to community.
"The more testing that's done, the more infections you'll pick up," explained Dr. F. Perry Wilson, a physician at Yale University. The numbers can also be thrown off when tests are limited to certain groups of people.
"If the tests are being mostly given to people with a high probability of having been infected -- for example, they have had symptoms or work in a high-risk setting -- then we expect lots of the tests to be positive. But that doesn't tell us what proportion of the general public is likely to have been infected," said Eleanor Murray, an epidemiologist at Boston University.
These Stats Are More Meaningful
According to Dr. Wilson, it's more useful to keep two other statistics in mind: the number of COVID tests that are being performed in your community and the percentage that turn up positive, showing that people have the disease. (These numbers may or may not be available locally. Check the websites of your community's health department and local news media outlets.)
If the number of people being tested is going up, but the percentage of positive tests is going down, Dr. Wilson said, that's a good sign. But if both numbers are going up – the number of people tested and the percentage of positive results – then "that's a sign that there are more infections burning in the community."
It's especially worrisome if the percentage of positive cases is growing compared to previous days or weeks, he said. According to him, that's a warning of a "high-risk situation."
Dr. George Rutherford, an epidemiologist at University of California at San Francisco, offered this tip: If the percentage of positive tests steadily stays under 8 percent, that's generally a good sign.
There's one more caveat about case counts. It takes an average of a week for someone to be infected with COVID-19, develop symptoms, and get tested, Dr. Rutherford said. It can take an additional several days for those test results to be reported to the county health department. This means that case numbers don't represent infections happening right now, but instead are a picture of the state of the pandemic more than a week ago.
Hospitalizations: Focus on Current Statistics
You should be able to find numbers about how many people in your community are currently hospitalized – or have been hospitalized – with diagnoses of COVID-19. But experts say these numbers aren't especially revealing unless you're able to see the number of new hospitalizations over time and track whether they're rising or falling. This number often isn't publicly available, however.
If new hospitalizations are increasing, "you may want to react by being more careful yourself."
And there's an important caveat: "The problem with hospitalizations is that they do lag," UC San Francisco's Dr. Martin said, since it takes time for someone to become ill enough to need to be hospitalized. "They tell you how much virus was being transmitted in your community 2 or 2.5 weeks ago."
Also, he said, people should be cautious about comparing new hospitalization rates between communities unless they're adjusted to account for the number of more-vulnerable older people.
Still, if new hospitalizations are increasing, he said, "you may want to react by being more careful yourself."
Deaths: They're an Even More Delayed Headline
Cable news networks obsessively track the number of coronavirus deaths nationwide, and death counts for every county in the country are available online. Local health departments and media websites may provide charts tracking the growth in deaths over time in your community.
But while death rates offer insight into the disease's horrific toll, they're not useful as an instant snapshot of the pandemic in your community because severely ill patients are typically sick for weeks. Instead, think of them as a delayed headline.
"These numbers don't tell you what's happening today. They tell you how much virus was being transmitted 3-4 weeks ago," Dr. Martin said.
'Reproduction Value': It May Be Revealing
You're not likely to find an available "reproduction value" for your community, but it is available for your state and may be useful.
A reproduction value, also known as R0 or R-naught, "tells us how many people on average we expect will be infected from a single case if we don't take any measures to intervene and if no one has been infected before," said Boston University's Murray.
As The New York Times explained, "R0 is messier than it might look. It is built on hard science, forensic investigation, complex mathematical models — and often a good deal of guesswork. It can vary radically from place to place and day to day, pushed up or down by local conditions and human behavior."
It may be impossible to find the R0 for your community. However, a website created by data specialists is providing updated estimates of a related number -- effective reproduction number, or Rt – for each state. (The R0 refers to how infectious the disease is in general and if precautions aren't taken. The Rt measures its infectiousness at a specific time – the "t" in Rt.) The site is at rt.live.
"The main thing to look at is whether the number is bigger than 1, meaning the outbreak is currently growing in your area, or smaller than 1, meaning the outbreak is currently decreasing in your area," Murray said. "It's also important to remember that this number depends on the prevention measures your community is taking. If the Rt is estimated to be 0.9 in your area and you are currently under lockdown, then to keep it below 1 you may need to remain under lockdown. Relaxing the lockdown could mean that Rt increases above 1 again."
"Whether they're on the upswing or downswing, no state is safe enough to ignore the precautions about mask wearing and social distancing."
Keep in mind that you can still become infected even if an outbreak in your community appears to be slowing. Low risk doesn't mean no risk.
Putting It All Together: Why the Numbers Matter
So you've reviewed COVID-19 statistics in your community. Now what?
Dr. Wilson suggests using the data to remind yourself that the coronavirus pandemic "is still out there. You need to take it seriously and continue precautions," he said. "Whether they're on the upswing or downswing, no state is safe enough to ignore the precautions about mask wearing and social distancing. 'My state is doing well, no one I know is sick, is it time to have a dinner party?' No."
He also recommends that laypeople avoid tracking COVID-19 statistics every day. "Check in once a week or twice a month to see how things are going," he suggested. "Don't stress too much. Just let it remind you to put that mask on before you get out of your car [and are around others]."
Send in the Robots: A Look into the Future of Firefighting
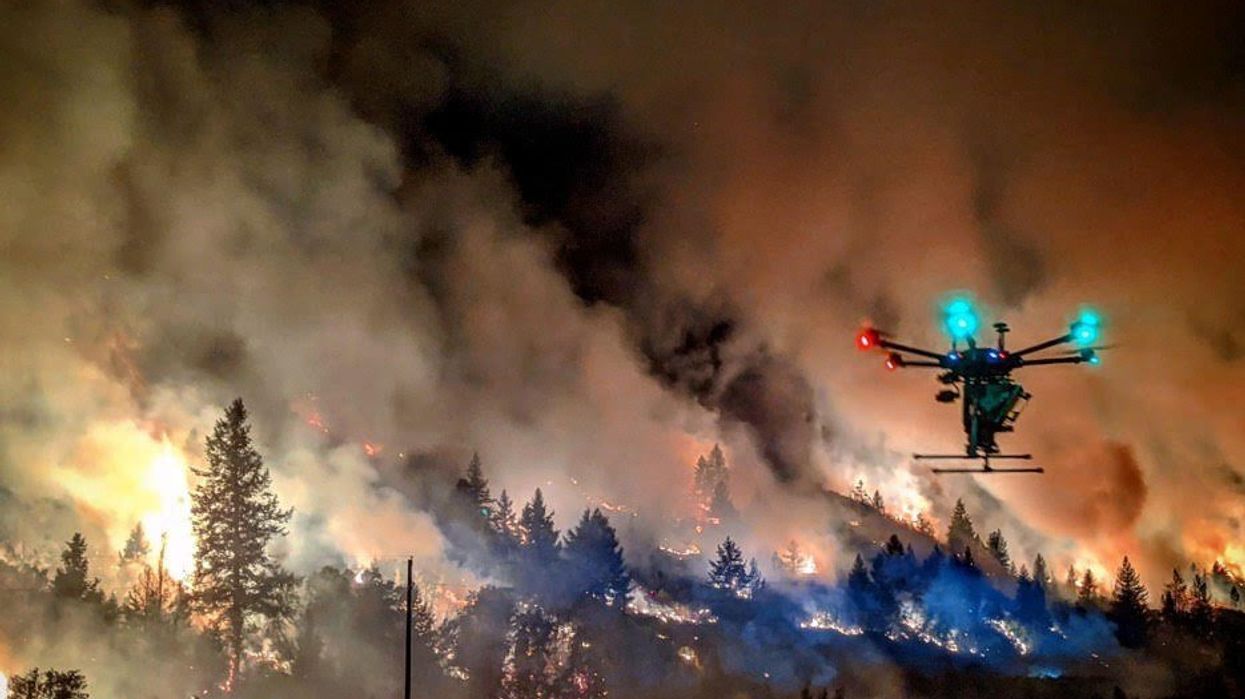
Drones are just one of several new technologies that are rising to the challenge of more frequent wildfires.
April in Paris stood still. Flames engulfed the beloved Notre Dame Cathedral as the world watched, horrified, in 2019. The worst looked inevitable when firefighters were forced to retreat from the out-of-control fire.
But the Paris Fire Brigade had an ace up their sleeve: Colossus, a firefighting robot. The seemingly indestructible tank-like machine ripped through the blaze with its motorized water cannon. It was able to put out flames in places that would have been deadly for firefighters.
Firefighting is entering a new era, driven by necessity. Conventional methods of managing fires have been no match for the fiercer, more expansive fires being triggered by climate change, urban sprawl, and susceptible wooded areas.
Robots have been a game-changer. Inspired by Paris, the Los Angeles Fire Department (LAFD) was the first in the U.S. to deploy a firefighting robot in 2021, the Thermite Robotics System 3 – RS3, for short.
RS3 is a 3,500-pound turbine on a crawler—the size of a Smart car—with a 36.8 horsepower engine that can go for 20 hours without refueling. It can plow through hazardous terrain, move cars from its path, and pull an 8,000-pound object from a fire.
All that while spurting 2,500 gallons of water per minute with a rear exhaust fan clearing the smoke. At a recent trade show, RS3 was billed as equivalent to 10 firefighters. The Los Angeles Times referred to it as “a droid on steroids.”
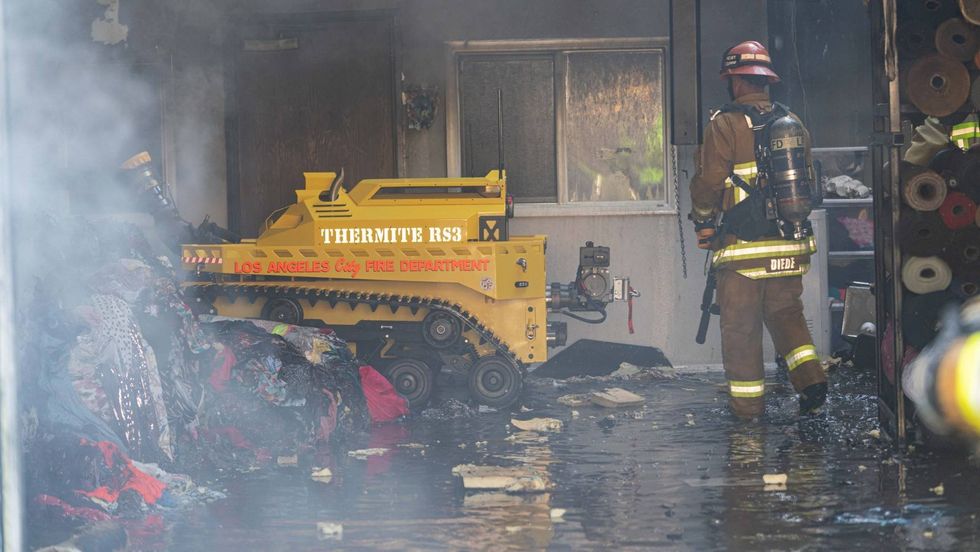
Robots such as the Thermite RS3 can plow through hazardous terrain and pull an 8,000-pound object from a fire.
Los Angeles Fire Department
The advantage of the robot is obvious. Operated remotely from a distance, it greatly reduces an emergency responder’s exposure to danger, says Wade White, assistant chief of the LAFD. The robot can be sent into airplane fires, nuclear reactors, hazardous areas with carcinogens (think East Palestine, Ohio), or buildings where a roof collapse is imminent.
Advances for firefighters are taking many other forms as well. Fibers have been developed that make the firefighter’s coat lighter and more protective from carcinogens. New wearable devices track firefighters’ biometrics in real time so commanders can monitor their heat stress and exertion levels. A sensor patch is in development which takes readings every four seconds to detect dangerous gases such as methane and carbon dioxide. A sonic fire extinguisher is being explored that uses low frequency soundwaves to remove oxygen from air molecules without unhealthy chemical compounds.
The demand for this technology is only increasing, especially with the recent rise in wildfires. In 2021, fires were responsible for 3,800 deaths and 14,700 injuries of civilians in this country. Last year, 68,988 wildfires burned down 7.6 million acres. Whether the next generation of firefighting can address these new challenges could depend on special cameras, robots of the aerial variety, AI and smart systems.
Fighting fire with cameras
Another key innovation for firefighters is a thermal imaging camera (TIC) that improves visibility through smoke. “At a fire, you might not see your hand in front of your face,” says White. “Using the TIC screen, you can find the door to get out safely or see a victim in the corner.” Since these cameras were introduced in the 1990s, the price has come down enough (from $10,000 or more to about $700) that every LAFD firefighter on duty has been carrying one since 2019, says White.
TICs are about the size of a cell phone. The camera can sense movement and body heat so it is ideal as a search tool for people trapped in buildings. If a firefighter has not moved in 30 seconds, the motion detector picks that up, too, and broadcasts a distress signal and directional information to others.
To enable firefighters to operate the camera hands-free, the newest TICs can attach inside a helmet. The firefighter sees the images inside their mask.
TICs also can be mounted on drones to get a bird’s-eye, 360 degree view of a disaster or scout for hot spots through the smoke. In addition, the camera can take photos to aid arson investigations or help determine the cause of a fire.
More help From above
Firefighters prefer the term “unmanned aerial systems” (UAS) to drones to differentiate them from military use.
A UAS carrying a camera can provide aerial scene monitoring and topography maps to help fire captains deploy resources more efficiently. At night, floodlights from the drone can illuminate the landscape for firefighters. They can drop off payloads of blankets, parachutes, life preservers or radio devices for stranded people to communicate, too. And like the robot, the UAS reduces risks for ground crews and helicopter pilots by limiting their contact with toxic fumes, hazardous chemicals, and explosive materials.
“The nice thing about drones is that they perform multiple missions at once,” says Sean Triplett, team lead of fire and aviation management, tools and technology at the Forest Service.
Experts predict we’ll see swarms of drones dropping water and fire retardant on burning buildings and forests in the near future.
The UAS is especially helpful during wildfires because it can track fires, get ahead of wind currents and warn firefighters of wind shifts in real time. The U.S. Forest Service also uses long endurance, solar-powered drones that can fly for up to 30 days at a time to detect early signs of wildfire. Wildfires are no longer seasonal in California – they are a year-long threat, notes Thanh Nguyen, fire captain at the Orange County Fire Authority.
In March, Nguyen’s crew deployed a drone to scope out a huge landslide following torrential rains in San Clemente, CA. Emergency responders used photos and videos from the drone to survey the evacuated area, enabling them to stay clear of ground on the hillside that was still sliding.
Improvements in drone batteries are enabling them to fly for longer with heavier payloads. Experts predict we’ll see swarms of drones dropping water and fire retardant on burning buildings and forests in the near future.
AI to the rescue
The biggest peril for a firefighter is often what they don’t see coming. Flashovers are a leading cause of firefighter deaths, for example. They occur when flammable materials in an enclosed area ignite almost instantaneously. Or dangerous backdrafts can happen when a firefighter opens a window or door; the air rushing in can ignite a fire without warning.
The Fire Fighting Technology Group at the National Institute of Standards and Technology (NIST) is developing tools and systems to predict these potentially lethal events with computer models and artificial intelligence.
Partnering with other institutions, NIST researchers developed the Flashover Prediction Neural Network (FlashNet) after looking at common house layouts and running sets of scenarios through a machine-learning model. In the lab, FlashNet was able to predict a flashover 30 seconds before it happened with 92.1% success. When ready for release, the technology will be bundled with sensors that are already installed in buildings, says Anthony Putorti, leader of the NIST group.
The NIST team also examined data from hundreds of backdrafts as a basis for a machine-learning model to predict them. In testing chambers the model predicted them correctly 70.8% of the time; accuracy increased to 82.4% when measures of backdrafts were taken in more positions at different heights in the chambers. Developers are working on how to integrate the AI into a small handheld device that can probe the air of a room through cracks around a door or through a created opening, Putorti says. This way, the air can be analyzed with the device to alert firefighters of any significant backdraft risk.
Early wildfire detection technologies based on AI are in the works, too. The Forest Service predicts the acreage burned each year during wildfires will more than triple in the next 80 years. By gathering information on historic fires, weather patterns, and topography, says White, AI can help firefighters manage wildfires before they grow out of control and create effective evacuation plans based on population data and fire patterns.
The future is connectivity
We are in our infancy with “smart firefighting,” says Casey Grant, executive director emeritus of the Fire Protection Research Foundation. Grant foresees a new era of cyber-physical systems for firefighters—a massive integration of wireless networks, advanced sensors, 3D simulations, and cloud services. To enhance teamwork, the system will connect all branches of emergency responders—fire, emergency medical services, law enforcement.
FirstNet (First Responder Network Authority) now provides a nationwide high-speed broadband network with 5G capabilities for first responders through a terrestrial cell network. Battling wildfires, however, the Forest Service needed an alternative because they don’t always have access to a power source. In 2022, they contracted with Aerostar for a high altitude balloon (60,000 feet up) that can extend cell phone power and LTE. “It puts a bubble of connectivity over the fire to hook in the internet,” Triplett explains.

A high altitude balloon, 60,000 feet high, can extend cell phone power and LTE, putting a "bubble" of internet connectivity over fires.
Courtesy of USDA Forest Service
Advances in harvesting, processing and delivering data will improve safety and decision-making for firefighters, Grant sums up. Smart systems may eventually calculate fire flow paths and make recommendations about the best ways to navigate specific fire conditions. NIST’s plan to combine FlashNet with sensors is one example.
The biggest challenge is developing firefighting technology that can work across multiple channels—federal, state, local and tribal systems as well as for fire, police and other emergency services— in any location, says Triplett. “When there’s a wildfire, there are no political boundaries,” he says. “All hands are on deck.”
New device can diagnose concussions using AI
A new test called the EyeBox could provide a more objective - and portable - tool to measure whether people have concussions in stadiums and hospitals.
For a long time after Mary Smith hit her head, she was not able to function. Test after test came back normal, so her doctors ruled out the concussion, but she knew something was wrong. Finally, when she took a test with a novel EyeBOX device, recently approved by the FDA, she learned she indeed had been dealing with the aftermath of a concussion.
“I felt like even my husband and doctors thought I was faking it or crazy,” recalls Smith, who preferred not to disclose her real name. “When I took the EyeBOX test it showed that my eyes were not moving together and my BOX score was abnormal.” To her diagnosticians, scientists at the Minneapolis-based company Oculogica who developed the EyeBOX, these markers were concussion signs. “I cried knowing that finally someone could figure out what was wrong with me and help me get better,” she says.
Concussion affects around 42 million people worldwide. While it’s increasingly common in the news because of sports injuries, anything that causes damage to the head, from a fall to a car accident, can result in a concussion. The sudden blow or jolt can disrupt the normal way the brain works. In the immediate aftermath, people may suffer from headaches, lose consciousness and experience dizziness, confusion and vomiting. Some recover but others have side effects that can last for years, particularly affecting memory and concentration.
There is no simple standard-of-care test to confirm a concussion or rule it out. Neither do they appear on MRI and CT scans. Instead, medical professionals use more indirect approaches that test symptoms of concussions, such as assessments of patients’ learning and memory skills, ability to concentrate and problem solving. They also look at balance and coordination. Most tests are in the form of questionnaires or symptom checklists. Consequently, they have limitations, can be biased and may miss a concussion or produce a false positive. Some people suspected of having a concussion may ordinarily have difficulties with literary and problem-solving tests because of language challenges or education levels.
Another problem with current tests is that patients, particularly soldiers who want to return to combat and athletes who would like to keep competing, could try and hide their symptoms to avoid being diagnosed with a brain injury. Trauma physicians who work with concussion patients have the need for a tool that is more objective and consistent.
“This type of assessment doesn’t rely on the patient's education level, willingness to follow instructions or cooperation. You can’t game this.” -- Uzma Samadani, founder of Oculogica
“The importance of having an objective measurement tool for the diagnosis of concussion is of great importance,” says Douglas Powell, associate professor of biomechanics at the University of Memphis, with research interests in sports injury and concussion. “While there are a number of promising systems or metrics, we have yet to develop a system that is portable, accessible and objective for use on the sideline and in the clinic. The EyeBOX may be able to address these issues, though time will be the ultimate test of performance.”
The EyeBOX as a window inside the brain
Using eye movements to diagnose a concussion has emerged as a promising technique since around 2010. Oculogica combined eye movements with AI to develop the EyeBOX to develop an unbiased objective diagnostic tool.
“What’s so great about this type of assessment is it doesn’t rely on the patient's education level, willingness to follow instructions or cooperation,” says Uzma Samadani, a neurosurgeon and brain injury researcher at the University of Minnesota, who founded Oculogica. “You can’t game this. It assesses functions that are prompted by your brain.”
In 2010, Samadani was working on a clinical trial to improve the outcome of brain injuries. The team needed some way to measure if seriously brain injured patients were improving. One thing patients could do was watch TV. So Samadani designed and patented an AI-based algorithm that tracks the relationship between eye movement and concussion.
The EyeBOX test requires patients to watch movie or music clips for 220 seconds. An eye tracking camera records subconscious eye movements, tracking eye positions 500 times per seconds as patients watch the video. It collects over 100,000 data points. The device then uses AI to assess whether there’s any disruptions from the normal way the eyes move.
Cranial nerves are responsible for transmitting information between the brain and the body. Many are involved in eye movement. Pressure caused by a concussion can affect how these nerves work. So tracking how the eyes move can indicate if there’s anything wrong with the cranial nerves and where the problem lies.
If someone is healthy, their eyes should be able to focus on an object, follow movement and both eyes should be coordinated with each other. The EyeBox can detect abnormalities. For example, if a patient’s eyes are coordinated but they are not moving as they should, that indicates issues in the central brain stem, whilst only one eye moving abnormally suggests that a particular nerve section is affected.
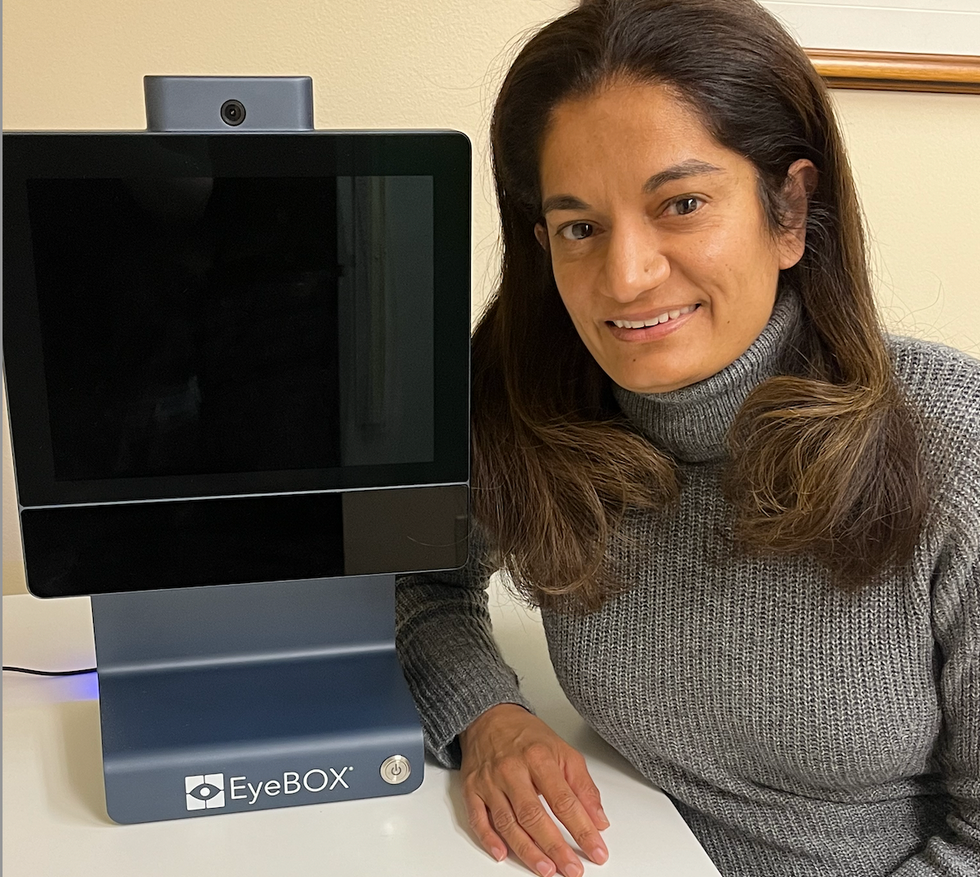
Uzma Samadani with the EyeBOX device
Courtesy Oculogica
“The EyeBOX is a monitor for cranial nerves,” says Samadani. “Essentially it’s a form of digital neurological exam. “Several other eye-tracking techniques already exist, but they rely on subjective self-reported symptoms. Many also require a baseline, a measure of how patients reacted when they were healthy, which often isn’t available.
VOMS (Vestibular Ocular Motor Screen) is one of the most accurate diagnostic tests used in clinics in combination with other tests, but it is subjective. It involves a therapist getting patients to move their head or eyes as they focus or follow a particular object. Patients then report their symptoms.
The King-Devick test measures how fast patients can read numbers and compares it to a baseline. Since it is mainly used for athletes, the initial test is completed before the season starts. But participants can manipulate it. It also cannot be used in emergency rooms because the majority of patients wouldn’t have prior baseline tests.
Unlike these tests, EyeBOX doesn’t use a baseline and is objective because it doesn’t rely on patients’ answers. “It shows great promise,” says Thomas Wilcockson, a senior lecturer of psychology in Loughborough University, who is an expert in using eye tracking techniques in neurological disorders. “Baseline testing of eye movements is not always possible. Alternative measures of concussion currently in development, including work with VR headsets, seem to currently require it. Therefore the EyeBOX may have an advantage.”
A technology that’s still evolving
In their last clinical trial, Oculogica used the EyeBOX to test 46 patients who had concussion and 236 patients who did not. The sensitivity of the EyeBOX, or the probability of it correctly identifying the patient’s concussion, was 80.4 percent. Meanwhile, the test accurately ruled out a concussion in 66.1 percent of cases. This is known as its specificity score.
While the team is working on improving the numbers, experts who treat concussion patients find the device promising. “I strongly support their use of eye tracking for diagnostic decision making,” says Douglas Powell. “But for diagnostic tests, we would prefer at least one of the sensitivity or specificity values to be greater than 90 percent. Powell compares EyeBOX with the Buffalo Concussion Treadmill Test, which has sensitivity and specificity values of 73 and 78 percent, respectively. The VOMS also has shown greater accuracy than the EyeBOX, at least for now. Still, EyeBOX is competitive with the best diagnostic testing available for concussion and Powell hopes that its detection prowess will improve. “I anticipate that the algorithms being used by Oculogica will be under continuous revision and expect the results will improve within the next several years.”
“The color of your skin can have a huge impact in how quickly you are triaged and managed for brain injury. People of color have significantly worse outcomes after traumatic brain injury than people who are white.” -- Uzma Samadani, founder of Oculogica
Powell thinks the EyeBOX could be an important complement to other concussion assessments.
“The Oculogica product is a viable diagnostic tool that supports clinical decision making. However, concussion is an injury that can present with a wide array of symptoms, and the use of technology such as the Oculogica should always be a supplement to patient interaction.”
Ioannis Mavroudis, a consultant neurologist at Leeds Teaching Hospital, agrees that the EyeBOX has promise, but cautions that concussions are too complex to rely on the device alone. For example, not all concussions affect how eyes move. “I believe that it can definitely help, however not all concussions show changes in eye movements. I believe that if this could be combined with a cognitive assessment the results would be impressive.”
The Oculogica team submitted their clinical data for FDA approval and received it in 2018. Now, they’re working to bring the test to the commercial market and using the device clinically to help diagnose concussions for clients. They also want to look at other areas of brain health in the next few years. Samadani believes that the EyeBOX could possibly be used to detect diseases like multiple sclerosis or other neurological conditions. “It’s a completely new way of figuring out what someone’s neurological exam is and we’re only beginning to realize the potential,” says Samadani.
One of Samadani’s biggest aspirations is to help reduce inequalities in healthcare because of skin color and other factors like money or language barriers. From that perspective, the EyeBOX’s greatest potential could be in emergency rooms. It can help diagnose concussions in addition to the questionnaires, assessments and symptom checklists, currently used in the emergency departments. Unlike these more subjective tests, EyeBOX can produce an objective analysis of brain injury through AI when patients are admitted and assessed, unrelated to their socioeconomic status, education, or language abilities. Studies suggest that there are racial disparities in how patients with brain injuries are treated, such as how quickly they're assessed and get a treatment plan.
“The color of your skin can have a huge impact in how quickly you are triaged and managed for brain injury,” says Samadani. “As a result of that, people of color have significantly worse outcomes after traumatic brain injury than people who are white. The EyeBOX has the potential to reduce inequalities,” she explains.
“If you had a digital neurological tool that you could screen and triage patients on admission to the emergency department you would potentially be able to make sure that everybody got the same standard of care,” says Samadani. “My goal is to change the way brain injury is diagnosed and defined.”
