Your Community and COVID-19: How to Make Sense of the Numbers Where You Live
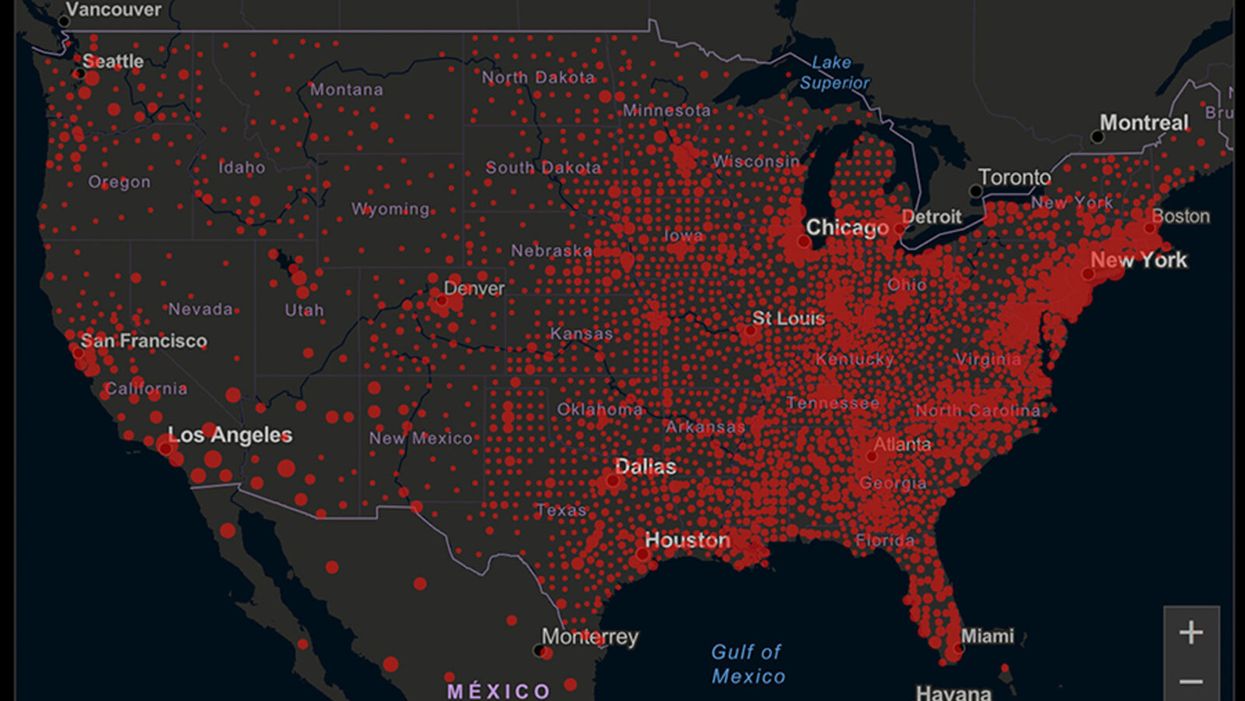
A map of cumulative known cases of COVID-19 in the U.S., as of June 12th, 2020.
Have you felt a bit like an armchair epidemiologist lately? Maybe you've been poring over coronavirus statistics on your county health department's website or on the pages of your local newspaper.
If the percentage of positive tests steadily stays under 8 percent, that's generally a good sign.
You're likely to find numbers and charts but little guidance about how to interpret them, let alone use them to make day-to-day decisions about pandemic safety precautions.
Enter the gurus. We asked several experts to provide guidance for laypeople about how to navigate the numbers. Here's a look at several common COVID-19 statistics along with tips about how to understand them.
Case Counts: Consider the Context
The number of confirmed COVID-19 cases in American counties is widely available. Local and state health departments should provide them online, or you can easily look them up at The New York Times' coronavirus database. However, you need to be cautious about interpreting them.
"Case counts are the obvious numbers to look at. But they're probably the hardest thing to sort out," said Dr. Jeff Martin, an epidemiologist at the University of California at San Francisco.
That's because case counts by themselves aren't a good window into how the coronavirus is affecting your community since they rely on testing. And testing itself varies widely from day to day and community to community.
"The more testing that's done, the more infections you'll pick up," explained Dr. F. Perry Wilson, a physician at Yale University. The numbers can also be thrown off when tests are limited to certain groups of people.
"If the tests are being mostly given to people with a high probability of having been infected -- for example, they have had symptoms or work in a high-risk setting -- then we expect lots of the tests to be positive. But that doesn't tell us what proportion of the general public is likely to have been infected," said Eleanor Murray, an epidemiologist at Boston University.
These Stats Are More Meaningful
According to Dr. Wilson, it's more useful to keep two other statistics in mind: the number of COVID tests that are being performed in your community and the percentage that turn up positive, showing that people have the disease. (These numbers may or may not be available locally. Check the websites of your community's health department and local news media outlets.)
If the number of people being tested is going up, but the percentage of positive tests is going down, Dr. Wilson said, that's a good sign. But if both numbers are going up – the number of people tested and the percentage of positive results – then "that's a sign that there are more infections burning in the community."
It's especially worrisome if the percentage of positive cases is growing compared to previous days or weeks, he said. According to him, that's a warning of a "high-risk situation."
Dr. George Rutherford, an epidemiologist at University of California at San Francisco, offered this tip: If the percentage of positive tests steadily stays under 8 percent, that's generally a good sign.
There's one more caveat about case counts. It takes an average of a week for someone to be infected with COVID-19, develop symptoms, and get tested, Dr. Rutherford said. It can take an additional several days for those test results to be reported to the county health department. This means that case numbers don't represent infections happening right now, but instead are a picture of the state of the pandemic more than a week ago.
Hospitalizations: Focus on Current Statistics
You should be able to find numbers about how many people in your community are currently hospitalized – or have been hospitalized – with diagnoses of COVID-19. But experts say these numbers aren't especially revealing unless you're able to see the number of new hospitalizations over time and track whether they're rising or falling. This number often isn't publicly available, however.
If new hospitalizations are increasing, "you may want to react by being more careful yourself."
And there's an important caveat: "The problem with hospitalizations is that they do lag," UC San Francisco's Dr. Martin said, since it takes time for someone to become ill enough to need to be hospitalized. "They tell you how much virus was being transmitted in your community 2 or 2.5 weeks ago."
Also, he said, people should be cautious about comparing new hospitalization rates between communities unless they're adjusted to account for the number of more-vulnerable older people.
Still, if new hospitalizations are increasing, he said, "you may want to react by being more careful yourself."
Deaths: They're an Even More Delayed Headline
Cable news networks obsessively track the number of coronavirus deaths nationwide, and death counts for every county in the country are available online. Local health departments and media websites may provide charts tracking the growth in deaths over time in your community.
But while death rates offer insight into the disease's horrific toll, they're not useful as an instant snapshot of the pandemic in your community because severely ill patients are typically sick for weeks. Instead, think of them as a delayed headline.
"These numbers don't tell you what's happening today. They tell you how much virus was being transmitted 3-4 weeks ago," Dr. Martin said.
'Reproduction Value': It May Be Revealing
You're not likely to find an available "reproduction value" for your community, but it is available for your state and may be useful.
A reproduction value, also known as R0 or R-naught, "tells us how many people on average we expect will be infected from a single case if we don't take any measures to intervene and if no one has been infected before," said Boston University's Murray.
As The New York Times explained, "R0 is messier than it might look. It is built on hard science, forensic investigation, complex mathematical models — and often a good deal of guesswork. It can vary radically from place to place and day to day, pushed up or down by local conditions and human behavior."
It may be impossible to find the R0 for your community. However, a website created by data specialists is providing updated estimates of a related number -- effective reproduction number, or Rt – for each state. (The R0 refers to how infectious the disease is in general and if precautions aren't taken. The Rt measures its infectiousness at a specific time – the "t" in Rt.) The site is at rt.live.
"The main thing to look at is whether the number is bigger than 1, meaning the outbreak is currently growing in your area, or smaller than 1, meaning the outbreak is currently decreasing in your area," Murray said. "It's also important to remember that this number depends on the prevention measures your community is taking. If the Rt is estimated to be 0.9 in your area and you are currently under lockdown, then to keep it below 1 you may need to remain under lockdown. Relaxing the lockdown could mean that Rt increases above 1 again."
"Whether they're on the upswing or downswing, no state is safe enough to ignore the precautions about mask wearing and social distancing."
Keep in mind that you can still become infected even if an outbreak in your community appears to be slowing. Low risk doesn't mean no risk.
Putting It All Together: Why the Numbers Matter
So you've reviewed COVID-19 statistics in your community. Now what?
Dr. Wilson suggests using the data to remind yourself that the coronavirus pandemic "is still out there. You need to take it seriously and continue precautions," he said. "Whether they're on the upswing or downswing, no state is safe enough to ignore the precautions about mask wearing and social distancing. 'My state is doing well, no one I know is sick, is it time to have a dinner party?' No."
He also recommends that laypeople avoid tracking COVID-19 statistics every day. "Check in once a week or twice a month to see how things are going," he suggested. "Don't stress too much. Just let it remind you to put that mask on before you get out of your car [and are around others]."
How to Measure Your Stress, with Dr. Rosalind Picard
Today’s podcast guest is Rosalind Picard, a researcher, inventor named on over 100 patents, entrepreneur, author, professor and engineer. When it comes to the science related to endowing computer software with emotional intelligence, she wrote the book. It’s published by MIT Press and called Affective Computing.
Dr. Picard is founder and director of the MIT Media Lab’s Affective Computing Research Group. Her research and engineering contributions have been recognized internationally. For example, she received the 2022 International Lombardy Prize for Computer Science Research, considered by many to be the Nobel prize in computer science.
Through her research and companies, Dr. Picard has developed wearable sensors, algorithms and systems for sensing, recognizing and responding to information about human emotion. Her products are focused on using fitness trackers to advance clinical quality treatments for a range of conditions.
Meanwhile, in just the past few years, numerous fitness tracking companies have released products with their own stress sensors and systems. You may have heard about Fitbit’s Stress Management Score, or Whoop’s Stress Monitor – these features and apps measure things like your heart rhythm and a certain type of invisible sweat to identify stress. They’re designed to raise awareness about forms of stress such as anxieties and anger, and suggest strategies like meditation to relax in real time when stress occurs.
But how well do these off-the-shelf gadgets work? There’s no one more knowledgeable and experienced than Rosalind Picard to explain the science behind these stress features, what they do exactly, how they might be able to help us, and their current shortcomings.
Dr. Picard is a member of the National Academy of Engineering and a Fellow of the National Academy of Inventors, and a popular speaker who’s given over a hundred invited keynote talks and a TED talk with over 2 million views. She holds a Bachelors in Electrical Engineering from Georgia Tech, and Masters and Doctorate degrees in Electrical Engineering and Computer Science from MIT. She lives in Newton, Massachusetts with her husband, where they’ve raised three sons.
In our conversation, we discuss stress scores on fitness trackers to improve well-being. She describes the difference between commercial products that might help people become more mindful of their health and products that are FDA approved and really capable of advancing the science. We also talk about several fascinating findings and concepts discovered in Dr. Picard’s lab including the multiple arousal theory, a phenomenon you’ll want to hear about. And we explore the complexity of stress, one reason it’s so tough to measure. For example, many forms of stress are actually good for us. Can fitness trackers tell the difference between stress that’s healthy and unhealthy?
Show links:
- Dr. Picard’s book, Affective Computing
- Dr. Picard’s bio
- Dr. Picard on Twitter
- Dr. Picard’s company, Empatica - https://www.empatica.com/ - The FDA-cleared Empatica Health Monitoring Platform provides accurate, continuous health insights for researchers and clinicians, collected in the real world
- Empatica Twitter
- Dr. Picard and her team have published hundreds of peer-reviewed articles across AI, Machine Learning, Affective Computing, Digital Health, and Human-computer interaction.
- Dr. Picard’s TED talk
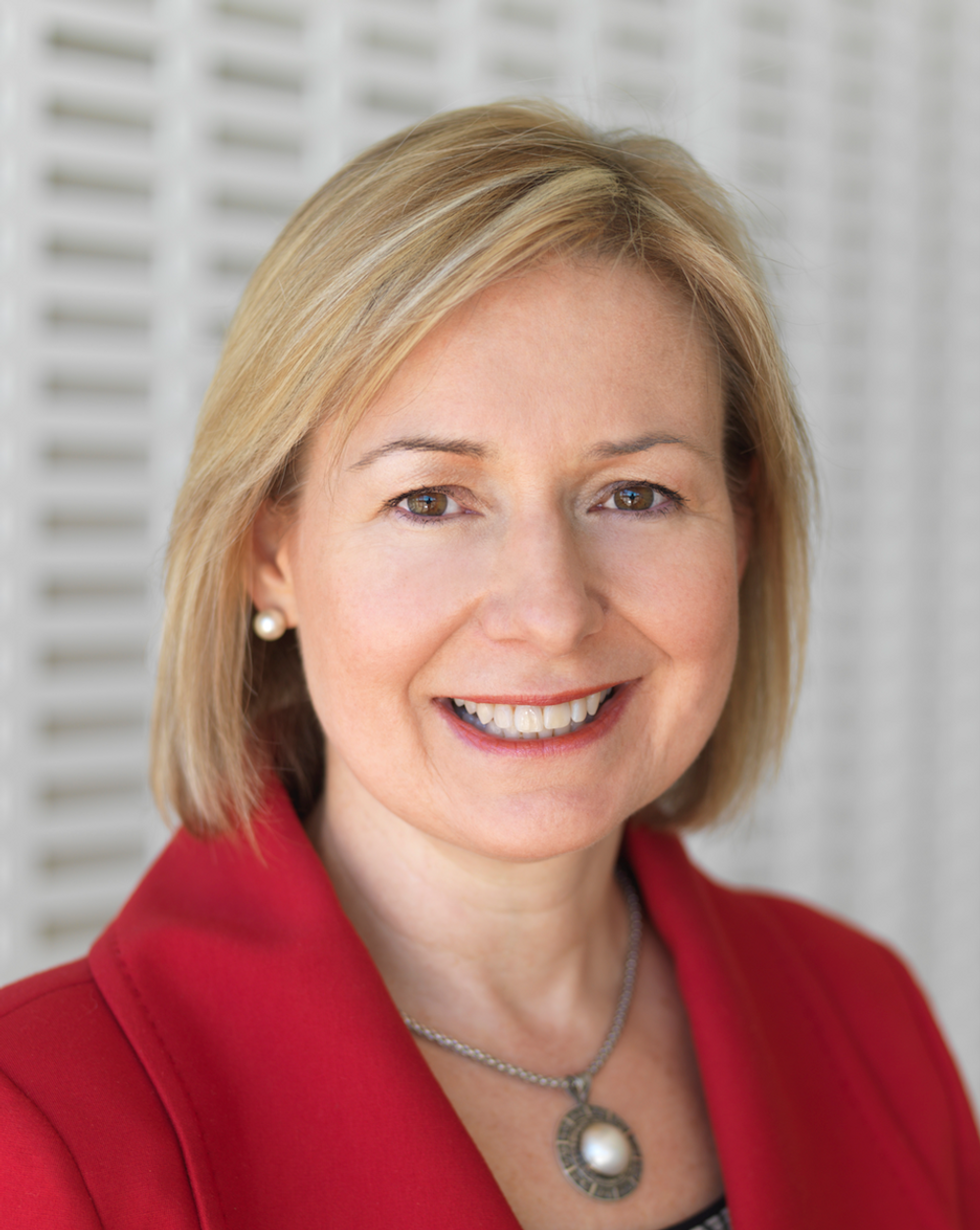
Rosalind Picard
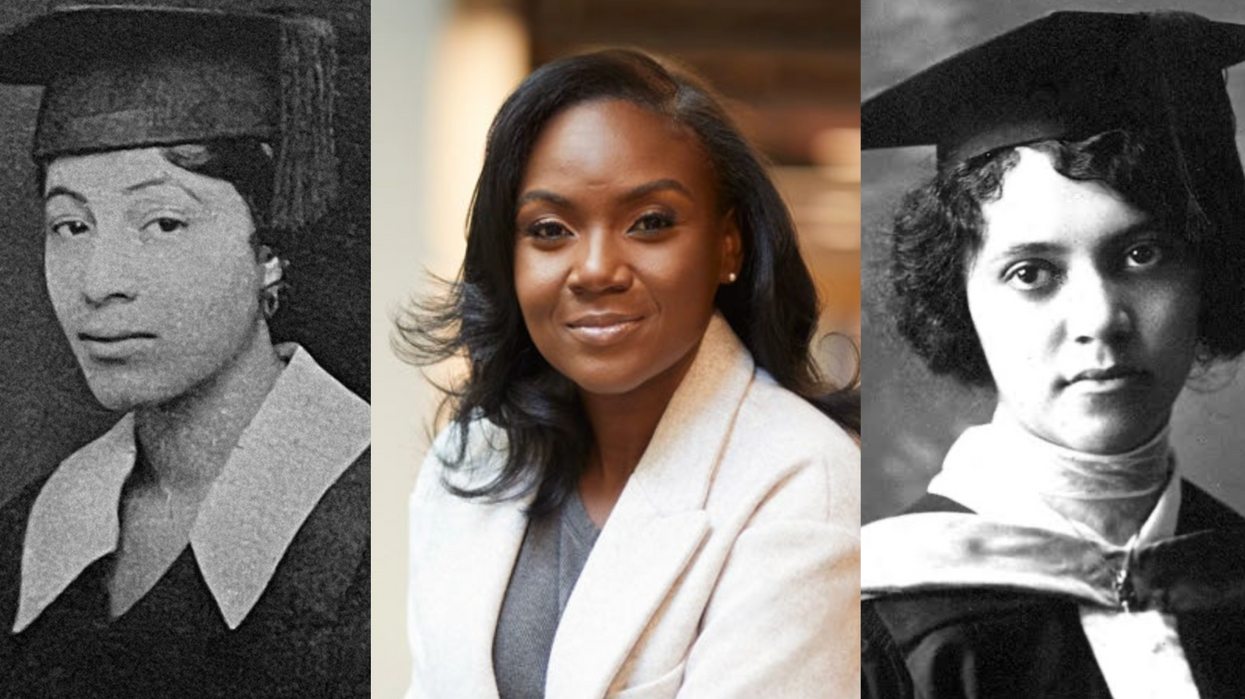
Dr. May Edward Chinn, Kizzmekia Corbett, PhD., and Alice Ball, among others, have been behind some of the most important scientific work of the last century.
If you look back on the last century of scientific achievements, you might notice that most of the scientists we celebrate are overwhelmingly white, while scientists of color take a backseat. Since the Nobel Prize was introduced in 1901, for example, no black scientists have landed this prestigious award.
The work of black women scientists has gone unrecognized in particular. Their work uncredited and often stolen, black women have nevertheless contributed to some of the most important advancements of the last 100 years, from the polio vaccine to GPS.
Here are five black women who have changed science forever.
Dr. May Edward Chinn
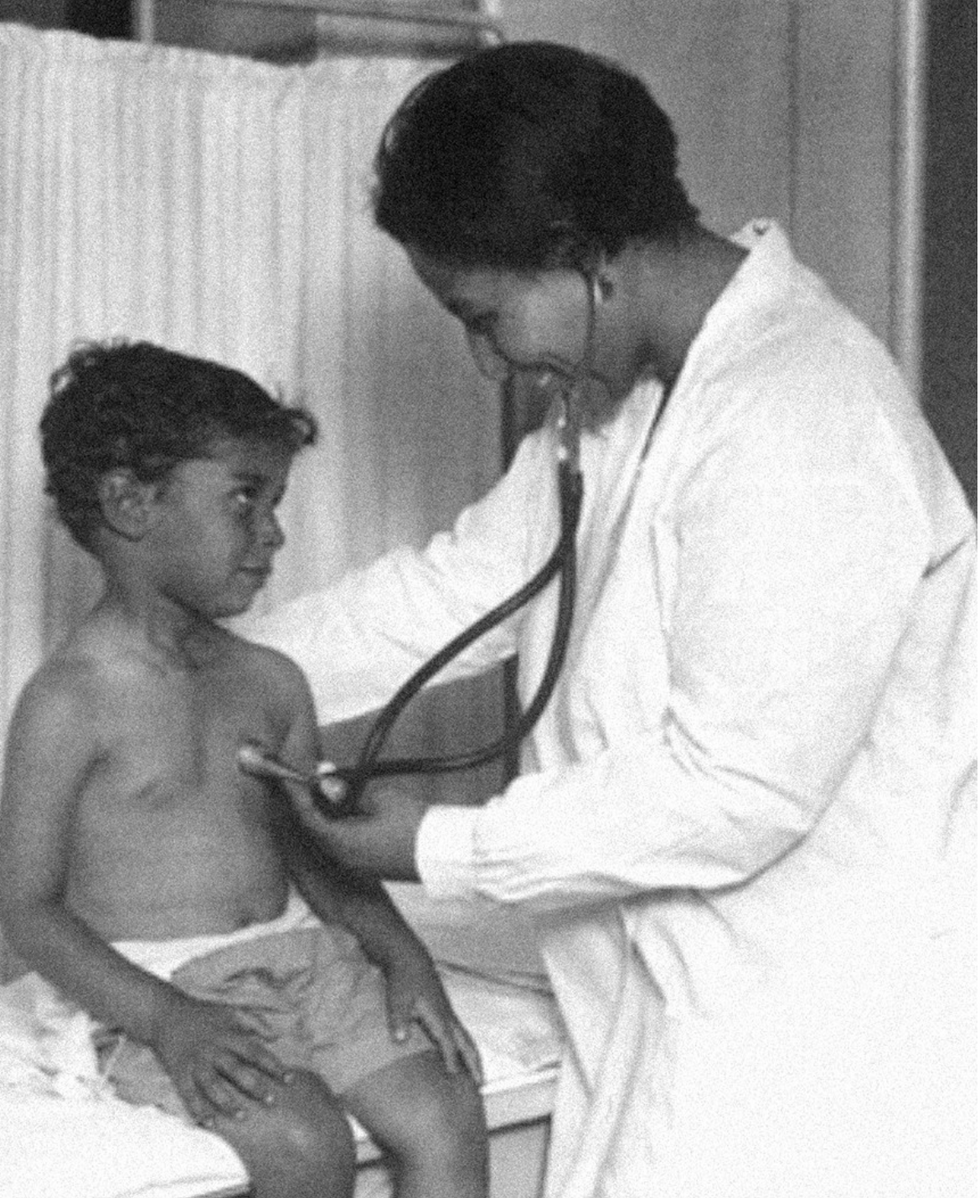
Dr. May Edward Chinn practicing medicine in Harlem
George B. Davis, PhD.
Chinn was born to poor parents in New York City just before the start of the 20th century. Although she showed great promise as a pianist, playing with the legendary musician Paul Robeson throughout the 1920s, she decided to study medicine instead. Chinn, like other black doctors of the time, were barred from studying or practicing in New York hospitals. So Chinn formed a private practice and made house calls, sometimes operating in patients’ living rooms, using an ironing board as a makeshift operating table.
Chinn worked among the city’s poor, and in doing this, started to notice her patients had late-stage cancers that often had gone undetected or untreated for years. To learn more about cancer and its prevention, Chinn begged information off white doctors who were willing to share with her, and even accompanied her patients to other clinic appointments in the city, claiming to be the family physician. Chinn took this information and integrated it into her own practice, creating guidelines for early cancer detection that were revolutionary at the time—for instance, checking patient health histories, checking family histories, performing routine pap smears, and screening patients for cancer even before they showed symptoms. For years, Chinn was the only black female doctor working in Harlem, and she continued to work closely with the poor and advocate for early cancer screenings until she retired at age 81.
Alice Ball
Pictorial Press Ltd/Alamy
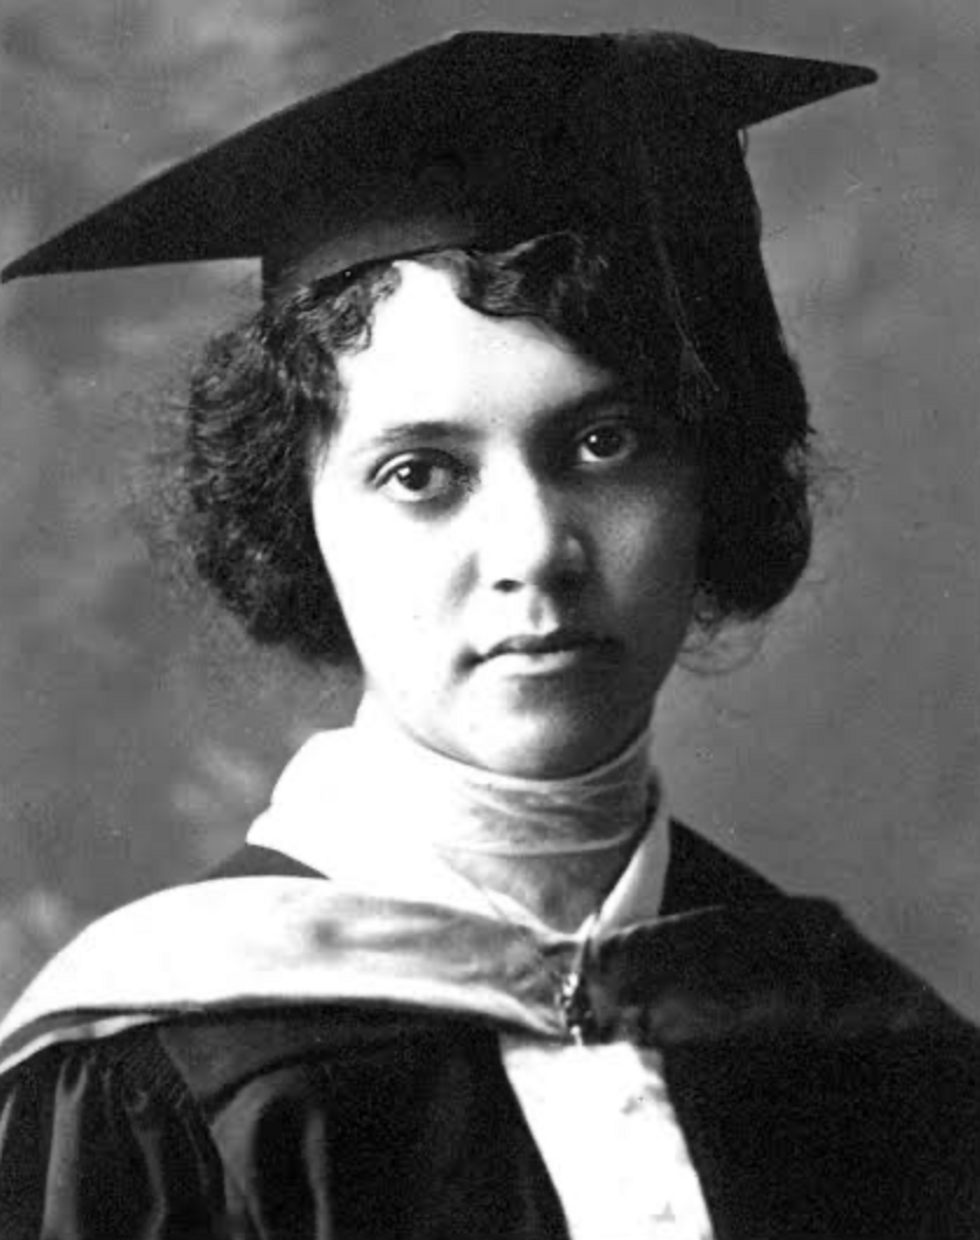
Alice Ball was a chemist best known for her groundbreaking work on the development of the “Ball Method,” the first successful treatment for those suffering from leprosy during the early 20th century.
In 1916, while she was an undergraduate student at the University of Hawaii, Ball studied the effects of Chaulmoogra oil in treating leprosy. This oil was a well-established therapy in Asian countries, but it had such a foul taste and led to such unpleasant side effects that many patients refused to take it.
So Ball developed a method to isolate and extract the active compounds from Chaulmoogra oil to create an injectable medicine. This marked a significant breakthrough in leprosy treatment and became the standard of care for several decades afterward.
Unfortunately, Ball died before she could publish her results, and credit for this discovery was given to another scientist. One of her colleagues, however, was able to properly credit her in a publication in 1922.
Henrietta Lacks
onathan Newton/The Washington Post/Getty
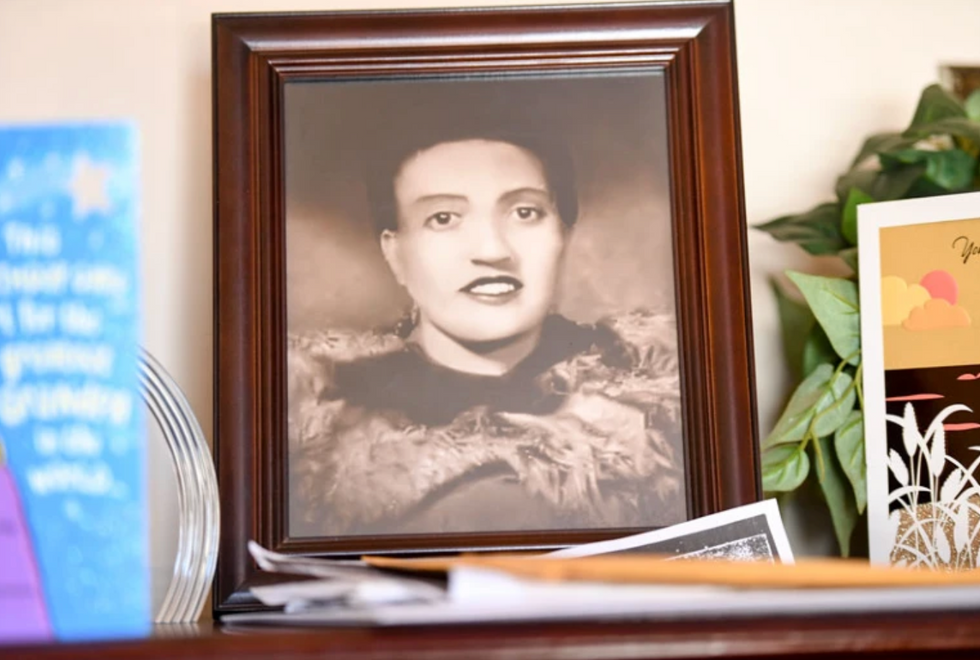
The person who arguably contributed the most to scientific research in the last century, surprisingly, wasn’t even a scientist. Henrietta Lacks was a tobacco farmer and mother of five children who lived in Maryland during the 1940s. In 1951, Lacks visited Johns Hopkins Hospital where doctors found a cancerous tumor on her cervix. Before treating the tumor, the doctor who examined Lacks clipped two small samples of tissue from Lacks’ cervix without her knowledge or consent—something unthinkable today thanks to informed consent practices, but commonplace back then.
As Lacks underwent treatment for her cancer, her tissue samples made their way to the desk of George Otto Gey, a cancer researcher at Johns Hopkins. He noticed that unlike the other cell cultures that came into his lab, Lacks’ cells grew and multiplied instead of dying out. Lacks’ cells were “immortal,” meaning that because of a genetic defect, they were able to reproduce indefinitely as long as certain conditions were kept stable inside the lab.
Gey started shipping Lacks’ cells to other researchers across the globe, and scientists were thrilled to have an unlimited amount of sturdy human cells with which to experiment. Long after Lacks died of cervical cancer in 1951, her cells continued to multiply and scientists continued to use them to develop cancer treatments, to learn more about HIV/AIDS, to pioneer fertility treatments like in vitro fertilization, and to develop the polio vaccine. To this day, Lacks’ cells have saved an estimated 10 million lives, and her family is beginning to get the compensation and recognition that Henrietta deserved.
Dr. Gladys West
Andre West
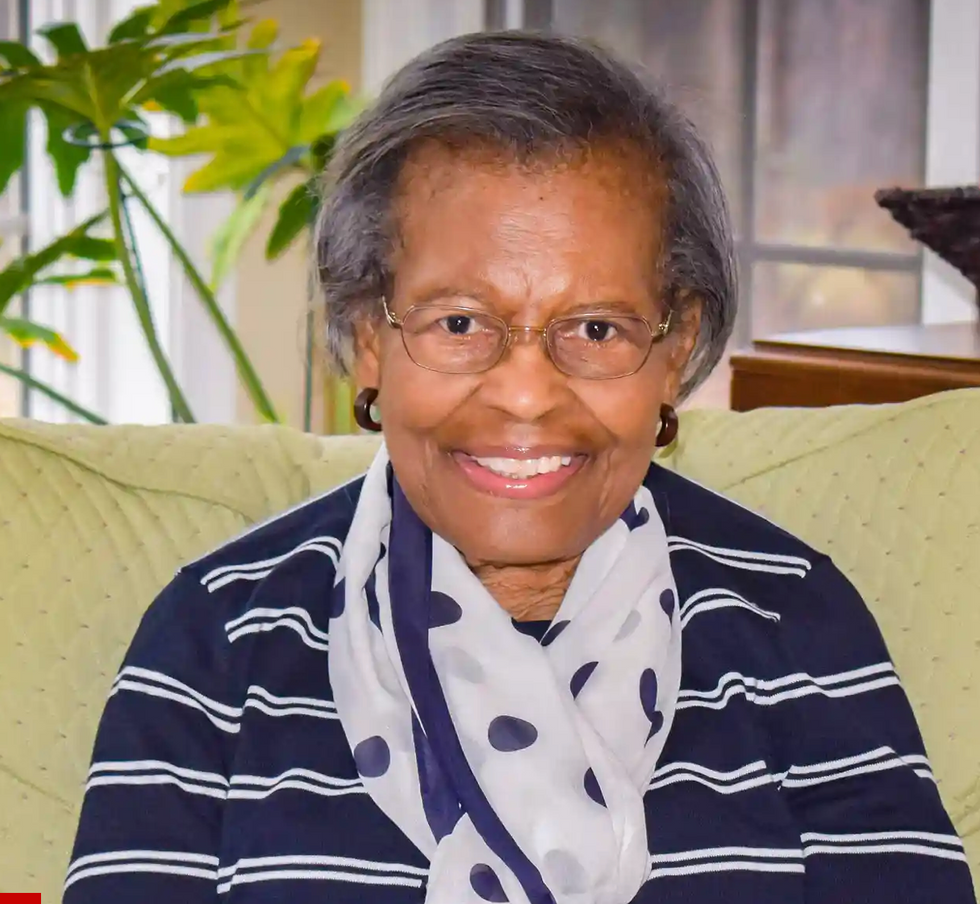
Gladys West was a mathematician who helped invent something nearly everyone uses today. West started her career in the 1950s at the Naval Surface Warfare Center Dahlgren Division in Virginia, and took data from satellites to create a mathematical model of the Earth’s shape and gravitational field. This important work would lay the groundwork for the technology that would later become the Global Positioning System, or GPS. West’s work was not widely recognized until she was honored by the US Air Force in 2018.
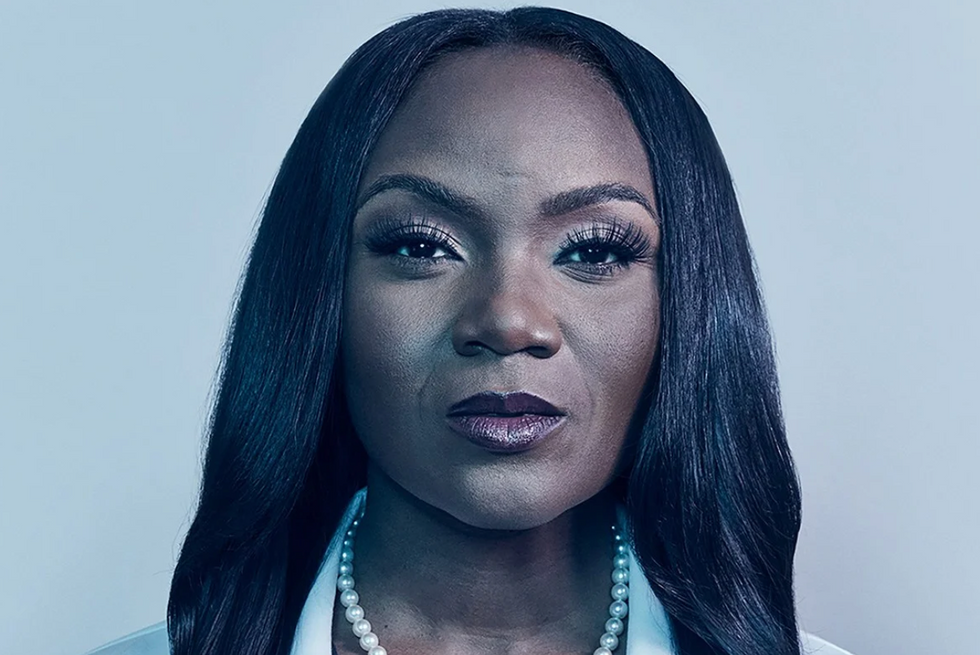
Dr. Kizzmekia "Kizzy" Corbett
TIME Magazine
At just 35 years old, immunologist Kizzmekia “Kizzy” Corbett has already made history. A viral immunologist by training, Corbett studied coronaviruses at the National Institutes of Health (NIH) and researched possible vaccines for coronaviruses such as SARS (Severe Acute Respiratory Syndrome) and MERS (Middle East Respiratory Syndrome).
At the start of the COVID pandemic, Corbett and her team at the NIH partnered with pharmaceutical giant Moderna to develop an mRNA-based vaccine against the virus. Corbett’s previous work with mRNA and coronaviruses was vital in developing the vaccine, which became one of the first to be authorized for emergency use in the United States. The vaccine, along with others, is responsible for saving an estimated 14 million lives.