Your Community and COVID-19: How to Make Sense of the Numbers Where You Live

Your Community and COVID-19: How to Make Sense of the Numbers Where You Live

A map of cumulative known cases of COVID-19 in the U.S., as of June 12th, 2020.

(Screenshot of Johns Hopkins' COVID-19 tracking dashboard at https://rb.gy/qtjbay)


Have you felt a bit like an armchair epidemiologist lately? Maybe you've been poring over coronavirus statistics on your county health department's website or on the pages of your local newspaper.

If the percentage of positive tests steadily stays under 8 percent, that's generally a good sign.

You're likely to find numbers and charts but little guidance about how to interpret them, let alone use them to make day-to-day decisions about pandemic safety precautions.

Enter the gurus. We asked several experts to provide guidance for laypeople about how to navigate the numbers. Here's a look at several common COVID-19 statistics along with tips about how to understand them.

Case Counts: Consider the Context

The number of confirmed COVID-19 cases in American counties is widely available. Local and state health departments should provide them online, or you can easily look them up at The New York Times' coronavirus database. However, you need to be cautious about interpreting them.

"Case counts are the obvious numbers to look at. But they're probably the hardest thing to sort out," said Dr. Jeff Martin, an epidemiologist at the University of California at San Francisco.

That's because case counts by themselves aren't a good window into how the coronavirus is affecting your community since they rely on testing. And testing itself varies widely from day to day and community to community.

"The more testing that's done, the more infections you'll pick up," explained Dr. F. Perry Wilson, a physician at Yale University. The numbers can also be thrown off when tests are limited to certain groups of people.

"If the tests are being mostly given to people with a high probability of having been infected -- for example, they have had symptoms or work in a high-risk setting -- then we expect lots of the tests to be positive. But that doesn't tell us what proportion of the general public is likely to have been infected," said Eleanor Murray, an epidemiologist at Boston University.

These Stats Are More Meaningful

According to Dr. Wilson, it's more useful to keep two other statistics in mind: the number of COVID tests that are being performed in your community and the percentage that turn up positive, showing that people have the disease. (These numbers may or may not be available locally. Check the websites of your community's health department and local news media outlets.)

If the number of people being tested is going up, but the percentage of positive tests is going down, Dr. Wilson said, that's a good sign. But if both numbers are going up – the number of people tested and the percentage of positive results – then "that's a sign that there are more infections burning in the community."

It's especially worrisome if the percentage of positive cases is growing compared to previous days or weeks, he said. According to him, that's a warning of a "high-risk situation."

Dr. George Rutherford, an epidemiologist at University of California at San Francisco, offered this tip: If the percentage of positive tests steadily stays under 8 percent, that's generally a good sign.

There's one more caveat about case counts. It takes an average of a week for someone to be infected with COVID-19, develop symptoms, and get tested, Dr. Rutherford said. It can take an additional several days for those test results to be reported to the county health department. This means that case numbers don't represent infections happening right now, but instead are a picture of the state of the pandemic more than a week ago.

Hospitalizations: Focus on Current Statistics

You should be able to find numbers about how many people in your community are currently hospitalized – or have been hospitalized – with diagnoses of COVID-19. But experts say these numbers aren't especially revealing unless you're able to see the number of new hospitalizations over time and track whether they're rising or falling. This number often isn't publicly available, however.

If new hospitalizations are increasing, "you may want to react by being more careful yourself."

And there's an important caveat: "The problem with hospitalizations is that they do lag," UC San Francisco's Dr. Martin said, since it takes time for someone to become ill enough to need to be hospitalized. "They tell you how much virus was being transmitted in your community 2 or 2.5 weeks ago."

Also, he said, people should be cautious about comparing new hospitalization rates between communities unless they're adjusted to account for the number of more-vulnerable older people.

Still, if new hospitalizations are increasing, he said, "you may want to react by being more careful yourself."

Deaths: They're an Even More Delayed Headline

Cable news networks obsessively track the number of coronavirus deaths nationwide, and death counts for every county in the country are available online. Local health departments and media websites may provide charts tracking the growth in deaths over time in your community.

But while death rates offer insight into the disease's horrific toll, they're not useful as an instant snapshot of the pandemic in your community because severely ill patients are typically sick for weeks. Instead, think of them as a delayed headline.

"These numbers don't tell you what's happening today. They tell you how much virus was being transmitted 3-4 weeks ago," Dr. Martin said.

'Reproduction Value': It May Be Revealing

You're not likely to find an available "reproduction value" for your community, but it is available for your state and may be useful.

A reproduction value, also known as R0 or R-naught, "tells us how many people on average we expect will be infected from a single case if we don't take any measures to intervene and if no one has been infected before," said Boston University's Murray.

As The New York Times explained, "R0 is messier than it might look. It is built on hard science, forensic investigation, complex mathematical models — and often a good deal of guesswork. It can vary radically from place to place and day to day, pushed up or down by local conditions and human behavior."

It may be impossible to find the R0 for your community. However, a website created by data specialists is providing updated estimates of a related number -- effective reproduction number, or Rt – for each state. (The R0 refers to how infectious the disease is in general and if precautions aren't taken. The Rt measures its infectiousness at a specific time – the "t" in Rt.) The site is at rt.live.

"The main thing to look at is whether the number is bigger than 1, meaning the outbreak is currently growing in your area, or smaller than 1, meaning the outbreak is currently decreasing in your area," Murray said. "It's also important to remember that this number depends on the prevention measures your community is taking. If the Rt is estimated to be 0.9 in your area and you are currently under lockdown, then to keep it below 1 you may need to remain under lockdown. Relaxing the lockdown could mean that Rt increases above 1 again."

"Whether they're on the upswing or downswing, no state is safe enough to ignore the precautions about mask wearing and social distancing."

Keep in mind that you can still become infected even if an outbreak in your community appears to be slowing. Low risk doesn't mean no risk.

Putting It All Together: Why the Numbers Matter

So you've reviewed COVID-19 statistics in your community. Now what?

Dr. Wilson suggests using the data to remind yourself that the coronavirus pandemic "is still out there. You need to take it seriously and continue precautions," he said. "Whether they're on the upswing or downswing, no state is safe enough to ignore the precautions about mask wearing and social distancing. 'My state is doing well, no one I know is sick, is it time to have a dinner party?' No."

He also recommends that laypeople avoid tracking COVID-19 statistics every day. "Check in once a week or twice a month to see how things are going," he suggested. "Don't stress too much. Just let it remind you to put that mask on before you get out of your car [and are around others]."

Randy Dotinga
Randy Dotinga is former president of the American Society of Journalists and Authors, a non-profit association of freelance writers and non-fiction authors. He has been a freelance writer since 1999 and specializes in health/medicine, politics, books, and the odd and unusual. You can follow him at @rdotinga.
Silkworms with spider DNA spin silk stronger than Kevlar

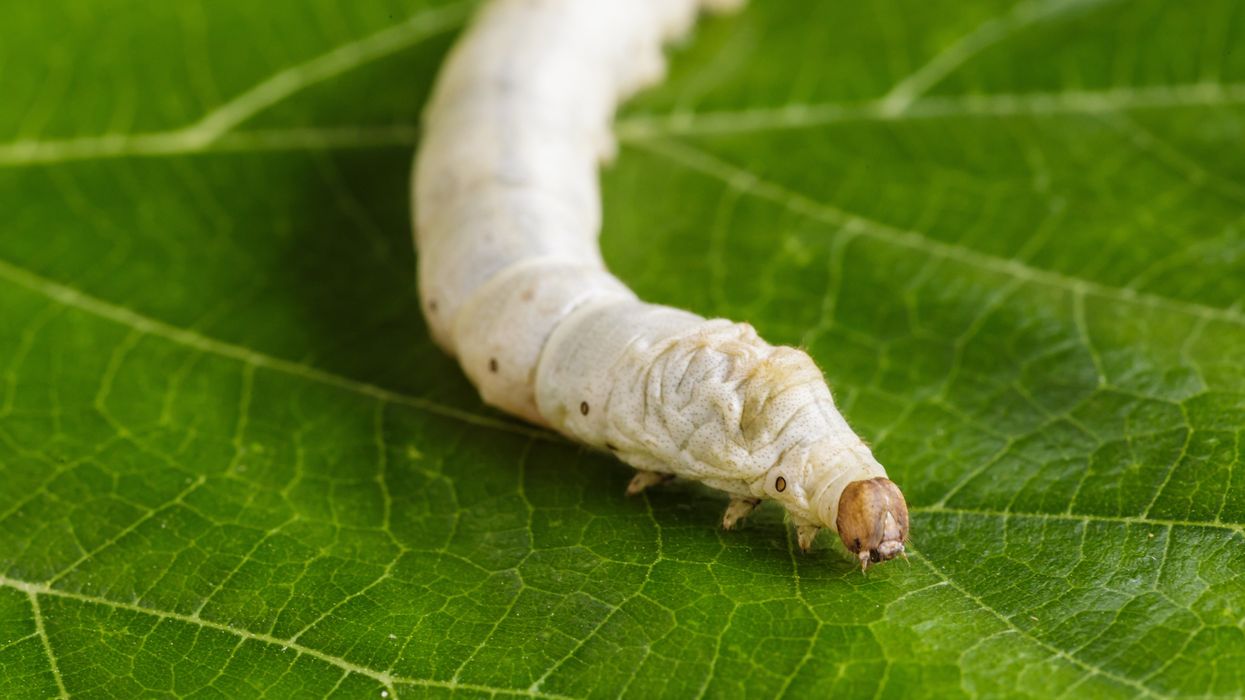
Silkworm silk is fragile, which limits its uses, but a few extra genes can help.

Adobe Stock

Story by Freethink

The study and copying of nature’s models, systems, or elements to address complex human challenges is known as “biomimetics.” Five hundred years ago, an elderly Italian polymath spent months looking at the soaring flight of birds. The result was Leonardo da Vinci’s biomimetic Codex on the Flight of Birds, one of the foundational texts in the science of aerodynamics. It’s the science that elevated the Wright Brothers and has yet to peak.

Keep Reading Keep Reading
Jonny Thomson
Jonny Thomson taught philosophy in Oxford for more than a decade before turning to writing full-time. He’s a staff writer at Big Think, where he writes about philosophy, theology, psychology, and occasionally other subjects when he dares step out of his lane. His first book, Mini Philosophy, is an award-winning, international bestseller, and has been translated into 20 languages. His second book, Mini Big Ideas, was published in 2023.
Gene Transfer Leads to Longer Life and Healthspan

In August, a study provided the first proof-of-principle that genetic material transferred from one species to another can increase both longevity and healthspan in the recipient animal.

Adobe Stock

The naked mole rat won’t win any beauty contests, but it could possibly win in the talent category. Its superpower: fighting the aging process to live several times longer than other animals its size, in a state of youthful vigor.

It’s believed that naked mole rats experience all the normal processes of wear and tear over their lifespan, but that they’re exceptionally good at repairing the damage from oxygen free radicals and the DNA errors that accumulate over time. Even though they possess genes that make them vulnerable to cancer, they rarely develop the disease, or any other age-related disease, for that matter. Naked mole rats are known to live for over 40 years without any signs of aging, whereas mice live on average about two years and are highly prone to cancer.

Now, these remarkable animals may be able to share their superpower with other species. In August, a study provided what may be the first proof-of-principle that genetic material transferred from one species can increase both longevity and healthspan in a recipient animal.

Keep Reading Keep Reading
Eve Herold
Eve Herold is an award-winning science writer and consultant in the scientific and medical nonprofit space. A longtime communications and policy executive for scientific organizations, she currently serves as Director of Policy Research and Education for the Healthspan Action Coalition. She has written extensively about issues at the crossroads of science and society, including regenerative medicine, aging and longevity, medical implants, transhumanism, robotics and AI, and bioethical issues in leading-edge medicine. Her books include Stem Cell Wars and Beyond Human, and her latest book, Robots and the People Who Love Them, will be released in January 2024. Her work has appeared in Vice, Medium, The Washington Post and the Boston Globe, among others. She’s a frequent contributor to Leaps.org and is the recipient of the 2019 Arlene Eisenberg Award from the American Society of Journalists and Authors.