

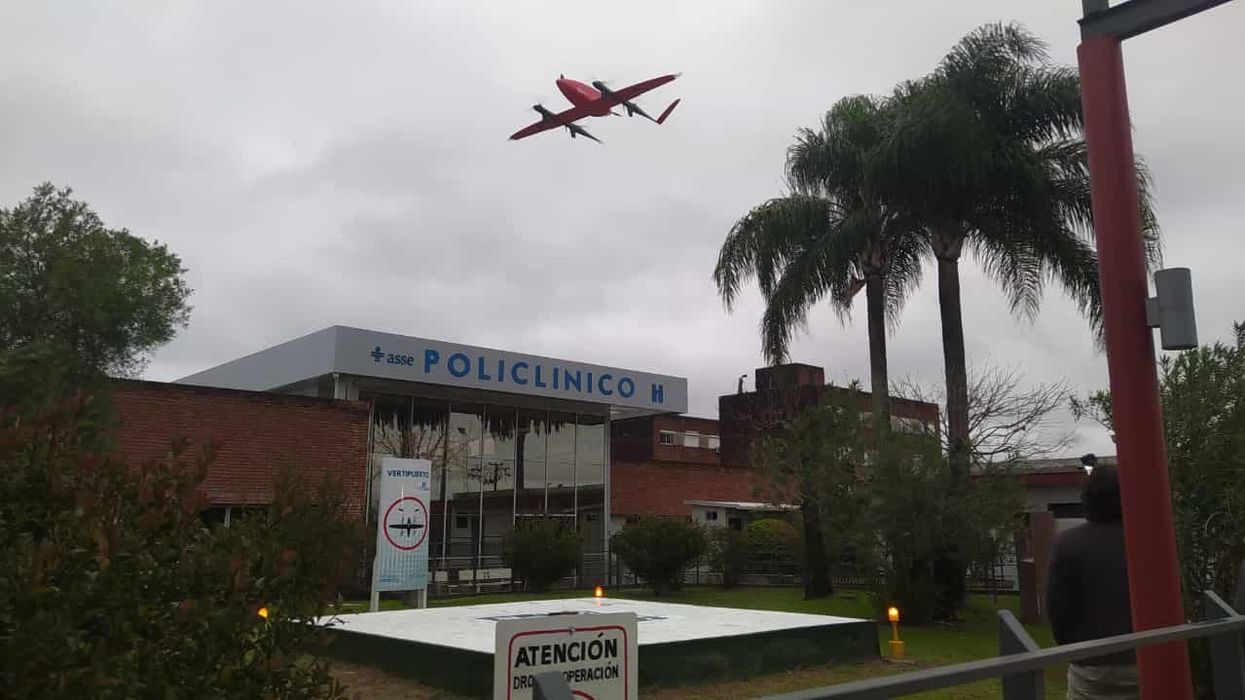
A drone hovers over Tacuarembó hospital in Uruguay, carrying its precious cargo: breast milk intended for children in remote parts of the country.
But these children need breast milk throughout their first six months, if not longer, to prevent malnutrition and other illnesses that are prevalent in rural Tacuarembó. Ground transport isn't quick or reliable enough to meet this goal. It can take several hours, during which the milk may spoil due to a lack of refrigeration.
The battery-powered drones have been the difference-maker. The project to develop them, financed by the UNICEF Innovation Fund, is the first of its kind in Latin America. To Castelli, it's nothing short of a revolution. Tacuarembó Hospital, along with three rural clinics in the most impoverished part of Uruguay, are its leaders.
"This marks the first occasion when the public health system has been directly impacted [by our technology]," says Sebastián Macías, the CEO and co-founder of Cielum, an engineer at the University Republic, which collaborated on the technology with a Uruguayan company called Cielum and a Swiss company, Rigitech.
The drone can achieve a top speed of up to 68 miles per hour, is capable of flying in light rain, and can withstand winds of up to 30 miles per hour at a maximum altitude of 120 meters.
"We have succeeded in embracing the mothers from rural areas who were previously slipping through the cracks of the system," says Ferreira, the hospital director. He envisions an expansion of the service so it can improve health for children in other rural areas.
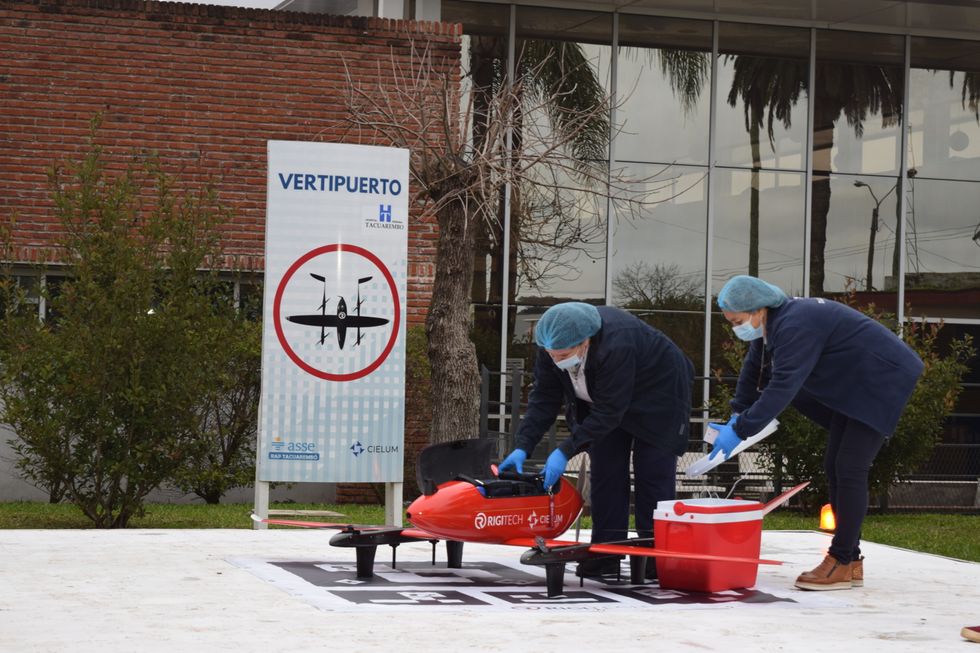
Nurses load the drone for breast milk delivery.
Sebastián Macías - Cielum
The star aircraft
The drone, which costs approximately $70,000, was specifically designed for the transportation of biological materials. Constructed from carbon fiber, it's three meters wide, two meters long and weighs 42 pounds when fully loaded. Additionally, it is equipped with a ballistic parachute to ensure a safe descent in case the technology fails in midair. Furthermore, it can achieve a top speed of 68 miles per hour, fly in light rain, and withstand winds of 30 miles per hour at a height of 120 meters.
Inside, the drones feature three refrigerated compartments that maintain a stable temperature and adhere to the United Nations’ standards for transporting perishable products. These compartments accommodate four gallons or 6.5 pounds of cargo. According to Macías, that's more than sufficient to carry a week’s worth of milk for one infant on just two flights, or 3.3 pounds of blood samples collected in a rural clinic.
“From an energy perspective, it serves as an efficient mode of transportation and helps reduce the carbon emissions associated with using an ambulance,” said Macías. Plus, the ambulance can remain available in the town.
Macías, who has led software development for the drone, and three other technicians have been trained to operate it. They ensure that the drone stays on course, monitor weather conditions and implement emergency changes when needed. The software displays the in-flight positions of the drones in relation to other aircraft. All agricultural planes in the region receive notification about the drone's flight path, departure and arrival times, and current location.
The future: doubling the drone's reach
Forty-five days after its inaugural flight, the drone is now making five flights per week. It serves two routes: 34 miles to Curtina and 31 miles to Tambores. The drone reaches Curtina in 50 minutes while ambulances take double that time, partly due to the subpar road conditions. Pueblo Ansina, located 40 miles from the state capital, will soon be introduced as the third destination.
Overall, the drone’s schedule is expected to become much busier, with plans to accomplish 20 weekly flights by the end of October and over 30 in 2024. Given the drone’s speed, Macías is contemplating using it to transport cancer medications as well.
“When it comes to using drones to save lives, for us, the sky is not the limit," says Ciro Ferreira, Tacuarembó hospital director.
In future trips to clinics in San Gregorio de Polanco and Caraguatá, the drone will be pushed to the limit. At these locations, a battery change will be necessary, but it's worth it. The route will cover up to 10 rural Tacuarembó clinics plus one hospital outside Tacuarembó, in Rivera, close to the border with Brazil. Currently, because of a shortage of ambulances, the delivery of pasteurized breast milk to Rivera only occurs every 15 days.
“The expansion to Rivera will include 100,000 more inhabitants, doubling the healthcare reach,” said Ferreira, the director of the Tacuarembó Hospital. In itself, Ferreira's hospital serves the medical needs of 500,000 people as one of the largest in Uruguay's interior.
Alejandro Del Estal, an aeronautical engineer at Rigitech, traveled from Europe to Tacuarembó to oversee the construction of the vertiports – the defined areas that can support drones’ take-off and landing – and the first flights. He pointed out that once the flight network between hospitals and rural polyclinics is complete in Uruguay, it will rank among the five most extensive drone routes in the world for any activity, including healthcare and commercial uses.
Cielum is already working on the long-term sustainability of the project. The aim is to have more drones operating in other rural regions in the western and northern parts of the country. The company has received inquiries from Argentina and Colombia, but, as Macías pointed out, they are exercising caution when making commitments. Expansion will depend on the development of each country’s regulations for airspace use.
For Ferreira, the advantages in Uruguay are evident: "This approach enables us to bridge the geographical gap, enhance healthcare accessibility, and reduce the time required for diagnosing and treating rural inhabitants, all without the necessity of them traveling to the hospital,” he says. "When it comes to using drones to save lives, for us, the sky is not the limit."
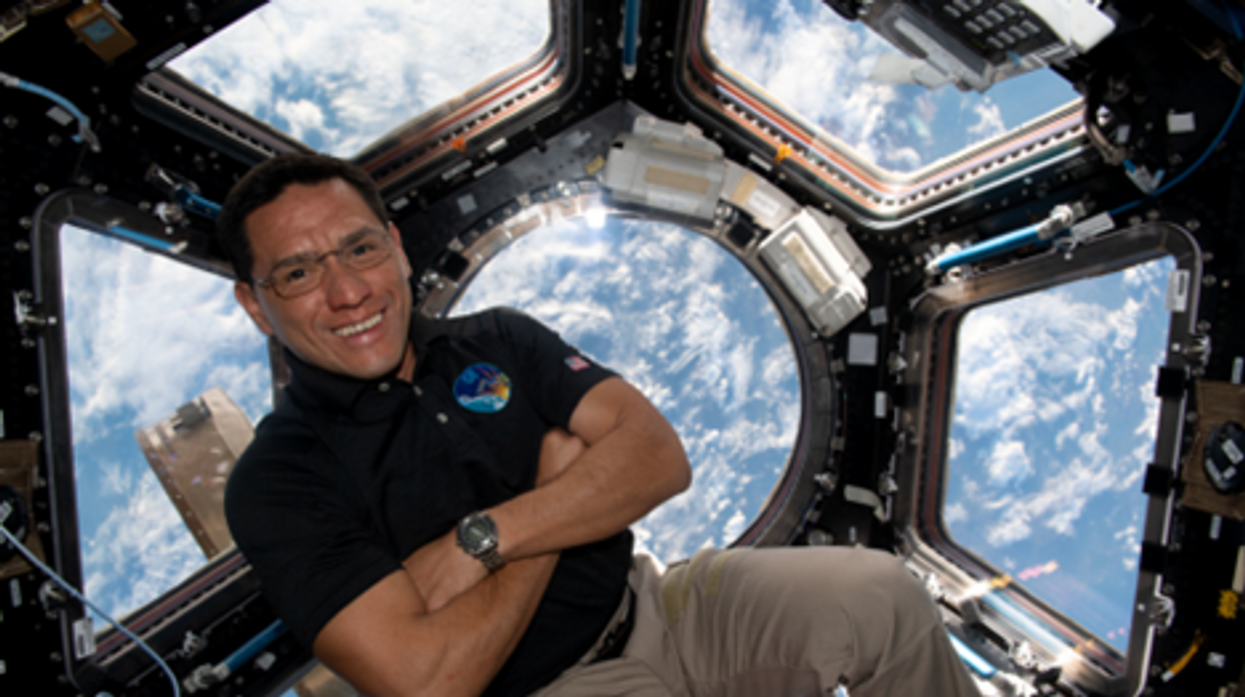
NASA astronaut Frank Rubio floats by the International Space Station’s “window to the world.” Yesterday, he returned from the longest single spaceflight by a U.S. astronaut on record - over one year. Exploring deep space will require even longer missions.
Yesterday, NASA astronaut Frank Rubio returned to Earth after over one year, the longest single spaceflight for a U.S. astronaut. But this is just the start; longer and more complex missions into deep space loom ahead, from returning to the moon in 2025 to eventually sending humans to Mars. To ensure that these missions succeed, NASA is increasing efforts to study the biological effects and prevent harm.
The dangers of microgravity are real
A NASA report published in 2016 details a long list of incidents and near-misses caused – at least partly – by space-induced changes in astronauts’ vision and coordination. These issues make it harder to move with precision and to judge distance and velocity.
According to the report, in 1997, a resupply ship collided with the Mir space station, possibly because a crew member bumped into the commander during the final docking maneuver. This mishap caused significant damage to the space station.
Returns to Earth suffered from problems, too. The same report notes that touchdown speeds during the first 100 space shuttle landings were “outside acceptable limits. The fastest landing on record – 224 knots (258 miles) per hour – was linked to the commander’s momentary spatial disorientation.” Earlier, each of the six Apollo crews that landed on the moon had difficulty recognizing moon landmarks and estimating distances. For example, Apollo 15 landed in an unplanned area, ultimately straddling the rim of a five-foot deep crater on the moon, harming one of its engines.
Spaceflight causes unique stresses on astronauts’ brains and central nervous systems. NASA is working to reduce these harmful effects.
NASA
Space messes up your brain
In space, astronauts face the challenges of microgravity, ionizing radiation, social isolation, high workloads, altered circadian rhythms, monotony, confined living quarters and a high-risk environment. Among these issues, microgravity is one of the most consequential in terms of physiological changes. It changes the brain’s structure and its functioning, which can hurt astronauts’ performance.
The brain shifts upwards within the skull, displacing the cerebrospinal fluid, which reduces the brain’s cushioning. Essentially, the brain becomes crowded inside the skull like a pair of too-tight shoes.
That’s partly because of how being in space alters blood flow. On Earth, gravity pulls our blood and other internal fluids toward our feet, but our circulatory valves ensure that the fluids are evenly distributed throughout the body. In space, there’s not enough gravity to pull the fluids down, and they shift up, says Rachael D. Seidler, a physiologist specializing in spaceflight at the University of Florida and principal investigator on many space-related studies. The head swells and legs appear thinner, causing what astronauts call “puffy face chicken legs.”
“The brain changes at the structural and functional level,” says Steven Jillings, equilibrium and aerospace researcher at the University of Antwerp in Belgium. “The brain shifts upwards within the skull,” displacing the cerebrospinal fluid, which reduces the brain’s cushioning. Essentially, the brain becomes crowded inside the skull like a pair of too-tight shoes. Some of the displaced cerebrospinal fluid goes into cavities within the brain, called ventricles, enlarging them. “The remaining fluids pool near the chest and heart,” explains Jillings. After 12 consecutive months in space, one astronaut had a ventricle that was 25 percent larger than before the mission.
Some changes reverse themselves while others persist for a while. An example of a longer-lasting problem is spaceflight-induced neuro-ocular syndrome, which results in near-sightedness and pressure inside the skull. A study of approximately 300 astronauts shows near-sightedness affects about 60 percent of astronauts after long missions on the International Space Station (ISS) and more than 25 percent after spaceflights of only a few weeks.
Another long-term change could be the decreased ability of cerebrospinal fluid to clear waste products from the brain, Seidler says. That’s because compressing the brain also compresses its waste-removing glymphatic pathways, resulting in inflammation, vulnerability to injuries and worsening its overall health.
The effects of long space missions were best demonstrated on astronaut twins Scott and Mark Kelly. This NASA Twins Study showed multiple, perhaps permanent, changes in Scott after his 340-day mission aboard the ISS, compared to Mark, who remained on Earth. The differences included declines in Scott’s speed, accuracy and cognitive abilities that persisted longer than six months after returning to Earth in March 2016.
By the end of 2020, Scott’s cognitive abilities improved, but structural and physiological changes to his eyes still remained, he said in a BBC interview.
“It seems clear that the upward shift of the brain and compression of the surrounding tissues with ventricular expansion might not be a good thing,” Seidler says. “But, at this point, the long-term consequences to brain health and human performance are not really known.”
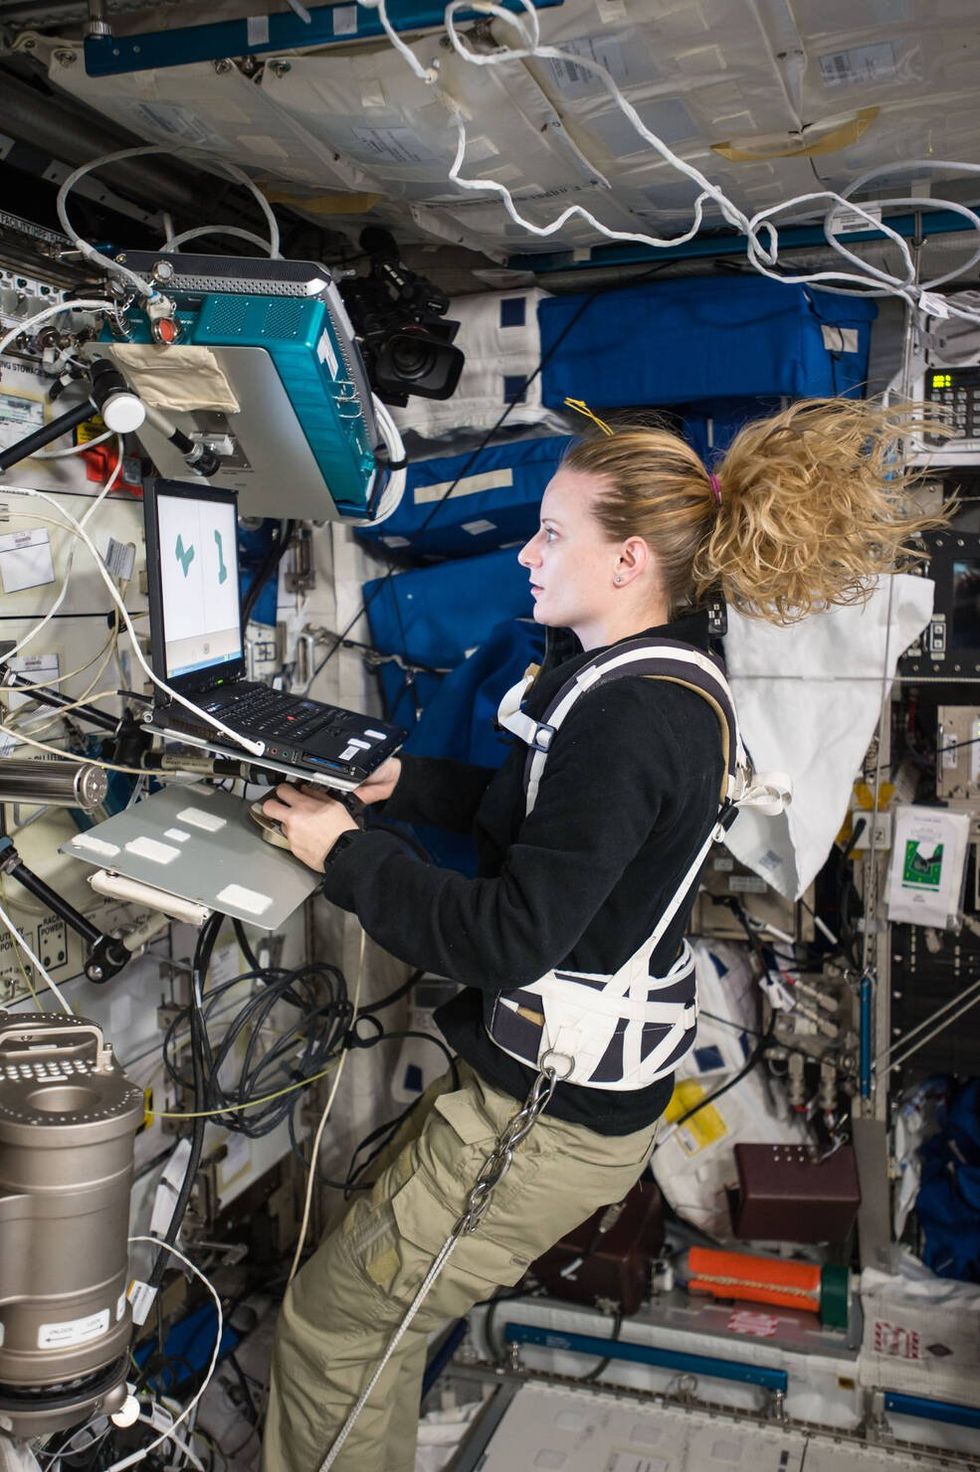
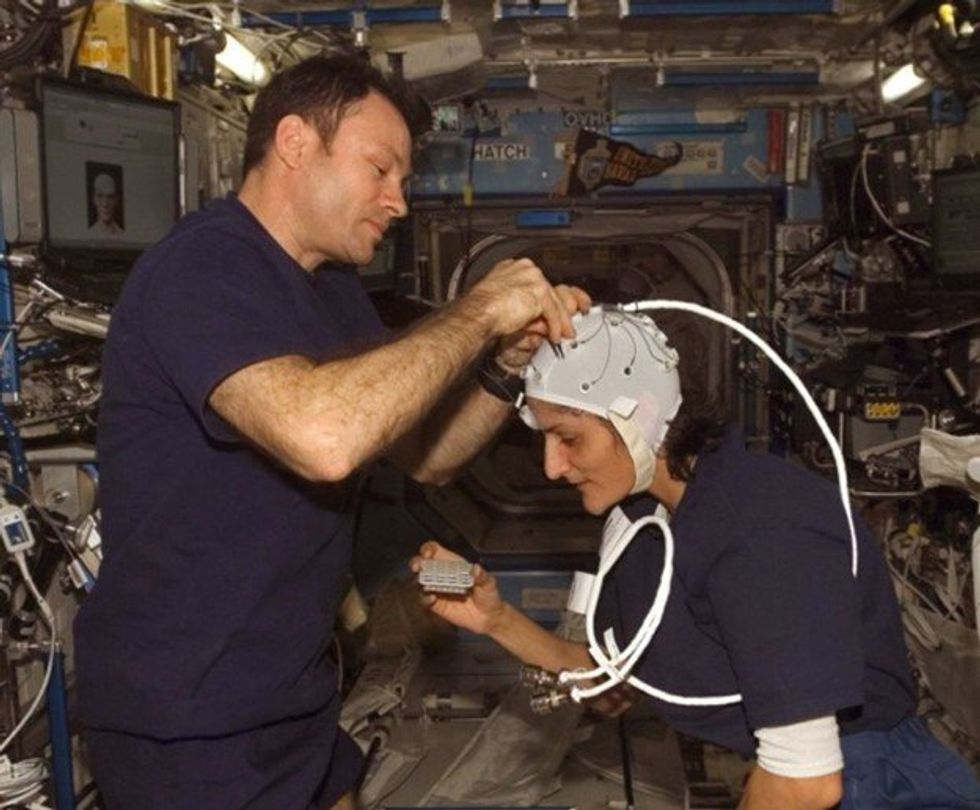
NASA astronaut Kate Rubins conducts a session for the Neuromapping investigation.
NASA
Staying sharp in space
To investigate how prolonged space travel affects the brain, NASA launched a new initiative called the Complement of Integrated Protocols for Human Exploration Research (CIPHER). “CIPHER investigates how long-duration spaceflight affects both brain structure and function,” says neurobehavioral scientist Mathias Basner at the University of Pennsylvania, a principal investigator for several NASA studies. “Through it, we can find out how the brain adapts to the spaceflight environment and how certain brain regions (behave) differently after – relative to before – the mission.”
To do this, he says, “Astronauts will perform NASA’s cognition test battery before, during and after six- to 12-month missions, and will also perform the same test battery in an MRI scanner before and after the mission. We have to make sure we better understand the functional consequences of spaceflight on the human brain before we can send humans safely to the moon and, especially, to Mars.”
As we go deeper into space, astronauts cognitive and physical functions will be even more important. “A trip to Mars will take about one year…and will introduce long communication delays,” Seidler says. “If you are on that mission and have a problem, it may take eight to 10 minutes for your message to reach mission control, and another eight to 10 minutes for the response to get back to you.” In an emergency situation, that may be too late for the response to matter.
“On a mission to Mars, astronauts will be exposed to stressors for unprecedented amounts of time,” Basner says. To counter them, NASA is considering the continuous use of artificial gravity during the journey, and Seidler is studying whether artificial gravity can reduce the harmful effects of microgravity. Some scientists are looking at precision brain stimulation as a way to improve memory and reduce anxiety due to prolonged exposure to radiation in space.
Other scientists are exploring how to protect neural stem cells (which create brain cells) from radiation damage, developing drugs to repair damaged brain cells and protect cells from radiation.
To boldly go where no astronauts have gone before, they must have optimal reflexes, vision and decision-making. In the era of deep space exploration, the brain—without a doubt—is the final frontier.
Additionally, NASA is scrutinizing each aspect of the mission, including astronaut exercise, nutrition and intellectual engagement. “We need to give astronauts meaningful work. We need to stimulate their sensory, cognitive and other systems appropriately,” Basner says, especially given their extreme confinement and isolation. The scientific experiments performed on the ISS – like studying how microgravity affects the ability of tissue to regenerate is a good example.
“We need to keep them engaged socially, too,” he continues. The ISS crew, for example, regularly broadcasts from space and answers prerecorded questions from students on Earth, and can engage with social media in real time. And, despite tight quarters, NASA is ensuring the crew capsule and living quarters on the moon or Mars include private space, which is critical for good mental health.
Exploring deep space builds on a foundation that began when astronauts first left the planet. With each mission, scientists learn more about spaceflight effects on astronauts’ bodies. NASA will be using these lessons to succeed with its plans to build science stations on the moon and, eventually, Mars.
“Through internally and externally led research, investigations implemented in space and in spaceflight simulations on Earth, we are striving to reduce the likelihood and potential impacts of neurostructural changes in future, extended spaceflight,” summarizes NASA scientist Alexandra Whitmire. To boldly go where no astronauts have gone before, they must have optimal reflexes, vision and decision-making. In the era of deep space exploration, the brain—without a doubt—is the final frontier.