

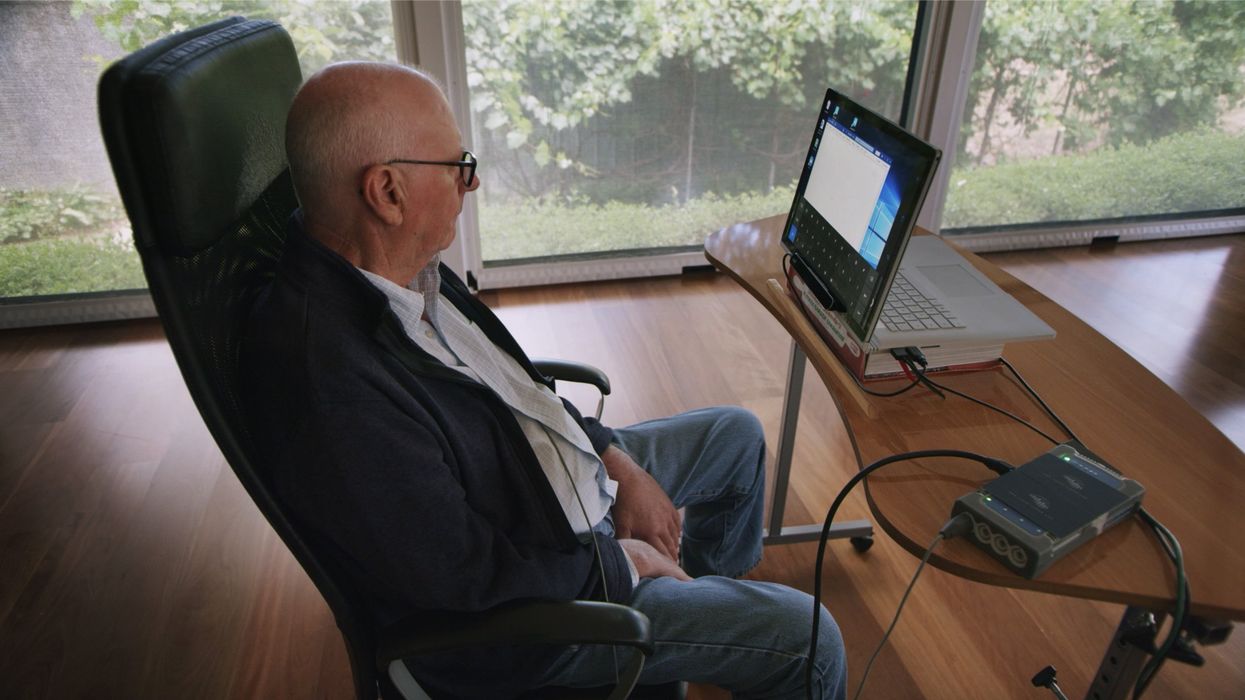
Leaps.org talks with Dr. Tom Oxley, founding CEO of Synchron, a company that's taking a unique - and less invasive - approach to "brain-computer interfaces" for patients with ALS and other mobility challenges.
Listen on Apple | Listen on Spotify | Listen on Stitcher | Listen on Amazon | Listen on Google
In our conversation, Dr. Oxley talks about “Bluetooth brain”; the critical role of AI in the present and future of BCIs; how BCIs compare to voice command technology; regulatory frameworks for revolutionary technologies; specific people with paralysis who’ve been able to regain some independence thanks to the Stentrode; what it means to be a neurointerventionist; how to scale BCIs for more people to use them; the risks of BCIs malfunctioning; organic implants; and how BCIs help us understand the brain, among other topics.
Dr. Oxley received his PhD in neuro engineering from the University of Melbourne in Australia. He is the founding CEO of Synchron and an associate professor and the head of the vascular bionics laboratory at the University of Melbourne. He’s also a clinical instructor in the Deepartment of Neurosurgery at Mount Sinai Hospital. Dr. Oxley has completed more than 1,600 endovascular neurosurgical procedures on patients, including people with aneurysms and strokes, and has authored over 100 peer reviewed articles.
Links:
Synchron website - https://synchron.com/
Assessment of Safety of a Fully Implanted Endovascular Brain-Computer Interface for Severe Paralysis in 4 Patients (paper co-authored by Tom Oxley) - https://jamanetwork.com/journals/jamaneurology/art...
More research related to Synchron's work - https://synchron.com/research
Tom Oxley on LinkedIn - https://www.linkedin.com/in/tomoxl
Tom Oxley on Twitter - https://twitter.com/tomoxl?lang=en
Tom Oxley TED - https://www.ted.com/talks/tom_oxley_a_brain_implant_that_turns_your_thoughts_into_text?language=en
Tom Oxley website - https://tomoxl.com/
Novel brain implant helps paralyzed woman speak using digital avatar - https://engineering.berkeley.edu/news/2023/08/novel-brain-implant-helps-paralyzed-woman-speak-using-a-digital-avatar/
Edward Chang lab - https://changlab.ucsf.edu/
BCIs convert brain activity into text at 62 words per minute - https://med.stanford.edu/neurosurgery/news/2023/he...
Leaps.org: The Mind-Blowing Promise of Neural Implants - https://leaps.org/the-mind-blowing-promise-of-neural-implants/

Tom Oxley

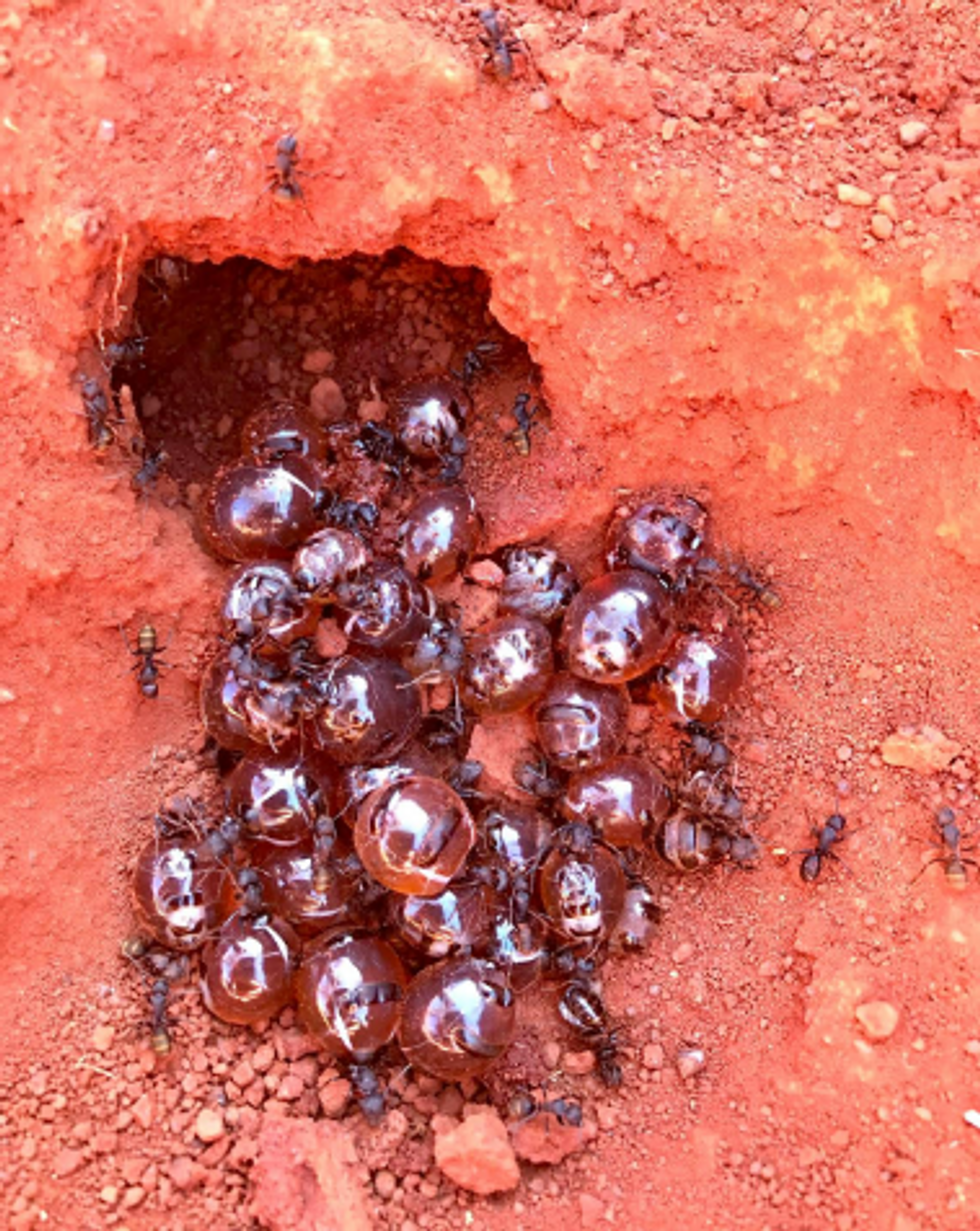
Indigenous people in Australia dig pits next to a honeypot colony. Scientists think the honey can be used to make new antimicrobial drugs.
These hunts have become rarer, as many of the Tjupan people have moved away and, up until now, the exact antimicrobial properties of the ant honey remained unknown. But recently, scientists Andrew Dong and Kenya Fernandes from the University of Sydney, joined Ulrich, who runs the Honeypot Ants tours in Kalgoorlie, a city in Western Australia, on a honey-gathering expedition. Afterwards, they ran a series of experiments analyzing the honey’s antimicrobial activity—and confirmed that the Indigenous wisdom was true. The honey was effective against Staphylococcus aureus, a common pathogen responsible for sore throats, skin infections like boils and sores, and also sepsis, which can result in death. Moreover, the honey also worked against two species of fungi, Cryptococcus and Aspergillus, which can be pathogenic to humans, especially those with suppressed immune systems.
In the era of growing antibiotic resistance and the rising threat of pathogenic fungi, these findings may help scientists identify and make new antimicrobial compounds. “Natural products have been honed over thousands and millions of years by nature and evolution,” says Fernandes. “And some of them have complex and intricate properties that make them really important as potential new antibiotics. “
In an era of growing resistance to antibiotics and new threats of fungi infections, the latest findings about honeypot ants are helping scientists identify new antimicrobial drugs.
Danny Ulrich
Bee honey is also known for its antimicrobial properties, but bees produce it very differently than the ants. Bees collect nectar from flowers, which they regurgitate at the hive and pack into the hexagonal honeycombs they build for storage. As they do so, they also add into the mix an enzyme called glucose oxidase produced by their glands. The enzyme converts atmospheric oxygen into hydrogen peroxide, a reactive molecule that destroys bacteria and acts as a natural preservative. After the bees pack the honey into the honeycombs, they fan it with their wings to evaporate the water. Once a honeycomb is full, the bees put a beeswax cover on it, where it stays well-preserved thanks to the enzymatic action, until the bees need it.
Less is known about the chemistry of ants’ honey-making. Similarly to bees, they collect nectar. They also collect the sweet sap of the mulga tree. Additionally, they also “milk” the aphids—small sap-sucking insects that live on the tree. When ants tickle the aphids with their antennae, the latter release a sweet substance, which the former also transfer to their colonies. That’s where the honey management difference becomes really pronounced. The ants don’t build any kind of structures to store their honey. Instead, they store it in themselves.
The workers feed their harvest to their fellow ants called repletes, stuffing them up to the point that their swollen bellies outgrow the ants themselves, looking like amber-colored honeypots—hence the name. Because of their size, repletes don’t move, but hang down from the chamber’s ceiling, acting as living feedstocks. When food becomes scarce, they regurgitate their reserves to their colony’s brethren. It’s not clear whether the repletes die afterwards or can be restuffed again. “That's a good question,” Dong says. “After they've been stretched, they can't really return to exactly the same shape.”
These replete ants are the “treat” the Tjupan women dug for. Once they saw the round-belly ants inside the chambers, they would reach in carefully and get a few scoops of them. “You see a lot of honeypot ants just hanging on the roof of the little openings,” says Ulrich’s mother, Edie Ulrich. The women would share the ants with family members who would eat them one by one. “They're very delicate,” shares Edie Ulrich—you have to take them out carefully, so they don’t accidentally pop and become a wasted resource. “Because you’d lose all this precious honey.”
Dong stumbled upon the honeypot ants phenomenon because he was interested in Indigenous foods and went on Ulrich’s tour. He quickly became fascinated with the insects and their role in the Indigenous culture. “The honeypot ants are culturally revered by the Indigenous people,” he says. Eventually he decided to test out the honey’s medicinal qualities.
The researchers were surprised to see that even the smallest, eight percent concentration of honey was able to arrest the growth of S. aureus.
To do this, the two scientists first diluted the ant honey with water. “We used something called doubling dilutions, which means that we made 32 percent dilutions, and then we halve that to 16 percent and then we half that to eight percent,” explains Fernandes. The goal was to obtain as much results as possible with the meager honey they had. “We had very, very little of the honeypot ant honey so we wanted to maximize the spectrum of results we can get without wasting too much of the sample.”
After that, the researchers grew different microbes inside a nutrient rich broth. They added the broth to the different honey dilutions and incubated the mixes for a day or two at the temperature favorable to the germs’ growth. If the resulting solution turned turbid, it was a sign that the bugs proliferated. If it stayed clear, it meant that the honey destroyed them. The researchers were surprised to see that even the smallest, eight percent concentration of honey was able to arrest the growth of S. aureus. “It was really quite amazing,” Fernandes says. “Eight milliliters of honey in 92 milliliters of water is a really tiny amount of honey compared to the amount of water.”
Similar to bee honey, the ants’ honey exhibited some peroxide antimicrobial activity, researchers found, but given how little peroxide was in the solution, they think the honey also kills germs by a different mechanism. “When we measured, we found that [the solution] did have some hydrogen peroxide, but it didn't have as much of it as we would expect based on how active it was,” Fernandes says. “Whether this hydrogen peroxide also comes from glucose oxidase or whether it's produced by another source, we don't really know,” she adds. The research team does have some hypotheses about the identity of this other germ-killing agent. “We think it is most likely some kind of antimicrobial peptide that is actually coming from the ant itself.”
The honey also has a very strong activity against the two types of fungi, Cryptococcus and Aspergillus. Both fungi are associated with trees and decaying leaves, as well as in the soils where ants live, so the insects likely have evolved some natural defense compounds, which end up inside the honey.
It wouldn’t be the first time when modern medicines take their origin from the natural world or from the indigenous people’s knowledge. The bark of the cinchona tree native to South America contains quinine, a substance that treats malaria. The Indigenous people of the Andes used the bark to quell fever and chills for generations, and when Europeans began to fall ill with malaria in the Amazon rainforest, they learned to use that medicine from the Andean people.
The wonder drug aspirin similarly takes its origin from a bark of a tree—in this case a willow.
Even some anticancer compounds originated from nature. A chemotherapy drug called Paclitaxel, was originally extracted from the Pacific yew trees, Taxus brevifolia. The samples of the Pacific yew bark were first collected in 1962 by researchers from the United States Department of Agriculture who were looking for natural compounds that might have anti-tumor activity. In December 1992, the FDA approved Paclitaxel (brand name Taxol) for the treatment of ovarian cancer and two years later for breast cancer.
In the era when the world is struggling to find new medicines fast enough to subvert a fungal or bacterial pandemic, these discoveries can pave the way to new therapeutics. “I think it's really important to listen to indigenous cultures and to take their knowledge because they have been using these sources for a really, really long time,” Fernandes says. Now we know it works, so science can elucidate the molecular mechanisms behind it, she adds. “And maybe it can even provide a lead for us to develop some kind of new treatments in the future.”