


Many women want non-hormonal birth control. A 22-year-old's findings were used to launch a company that could, within the decade, bring a new kind of contraceptive to the marketplace.
Now a scientist with NextVivo, Shrestha is not directly involved in the development of the contraceptive that is based on her research. But, back in 2016 when she was going through her own problems with hormonal contraceptives, she “was very personally invested” in her research project, Shrestha says. She was coping with a long list of negative effects from an implanted hormonal IUD. According to the Mayo Clinic, those can include severe pelvic pain, headaches, acute acne, breast tenderness, irregular bleeding and mood swings. After a year, she had the IUD removed, but it took another full year before all the side effects finally subsided; she also watched her sister suffer the “same tribulations” after trying a hormonal IUD, she says.
For contraceptive use either daily or monthly, Shrestha says, “You want the antibody to be very potent and also cheap.” That was her goal when she launched her study.
Shrestha unshelved antibody research that had been sitting idle for decades. It was in the late 80s that scientists in Japan first tried to develop anti-sperm antibodies for contraceptive use. But, 35 years ago, “Antibody production had not been streamlined as it is now, so antibodies were very expensive,” Shrestha explains. So, they shifted away from birth control, opting to focus on developing antibodies for vaccines.
Over the course of the last three decades, different teams of researchers have been working to make the antibody more effective, bringing the cost down, though it’s still expensive, according to Shrestha. For contraceptive use either daily or monthly, she says, “You want the antibody to be very potent and also cheap.” That was her goal when she launched her study.
The problem
The problem with contraceptives for women, Shrestha says, is that all but a few of them are hormone-based or have other negative side effects. In fact, some studies and reports show that millions of women risk unintended pregnancy because of medical contraindications with hormone-based contraceptives or to avoid the risks and side effects. While there are about a dozen contraceptive choices for women, there are two for men: the condom, considered 98% effective if used correctly, and vasectomy, 99% effective. Neither of these choices are hormone-based.
On the non-hormonal side for women, there is the diaphragm which is considered only 87 percent effective. It works better with the addition of spermicides — Nonoxynol-9, or N-9 — however, they are detergents; they not only kill the sperm, they also erode the vaginal epithelium. And, there’s the non-hormonal IUD which is 99% effective. However, the IUD needs to be inserted by a medical professional, and it has a number of negative side effects, including painful cramping at a higher frequency and extremely heavy or “abnormal” and unpredictable menstrual flows.
The hormonal version of the IUD, also considered 99% effective, is the one Shrestha used which caused her two years of pain. Of course, there’s the pill, which needs to be taken daily, and the birth control ring which is worn 24/7. Both cause side effects similar to the other hormonal contraceptives on the market. The ring is considered 93% effective mostly because of user error; the pill is considered 99% effective if taken correctly.
“That’s where we saw this opening or gap for women. We want a safe, non-hormonal contraceptive,” Shrestha says. Compounding the lack of good choices, is poor access to quality sex education and family planning information, according to the non-profit Urban Institute. A focus group survey suggested that the sex education women received “often lacked substance, leaving them feeling unprepared to make smart decisions about their sexual health and safety,” wrote the authors of the Urban Institute report. In fact, nearly half (45%, or 2.8 million) of the pregnancies that occur each year in the US are unintended, reports the Guttmacher Institute. Globally the numbers are similar. According to a new report by the United Nations, each year there are 121 million unintended pregnancies, worldwide.
The science
The early work on antibodies as a contraceptive had been inspired by women with infertility. It turns out that 9 to 12 percent of women who are treated for infertility have antibodies that develop naturally and work against sperm. Shrestha was encouraged that the antibodies were specific to the target — sperm — and therefore “very safe to use in women.” She aimed to make the antibodies more stable, more effective and less expensive so they could be more easily manufactured.
Since antibodies tend to stick to things that you tell them to stick to, the idea was, basically, to engineer antibodies to stick to sperm so they would stop swimming. Shrestha and her colleagues took the binding arm of an antibody that they’d isolated from an infertile woman. Then, targeting a unique surface antigen present on human sperm, they engineered a panel of antibodies with as many as six to 10 binding arms — “almost like tongs with prongs on the tongs, that bind the sperm,” explains Shrestha. “We decided to add those grabbers on top of it, behind it. So it went from having two prongs to almost 10. And the whole goal was to have so many arms binding the sperm that it clumps it” into a “dollop,” explains Shrestha, who earned a patent on her research.
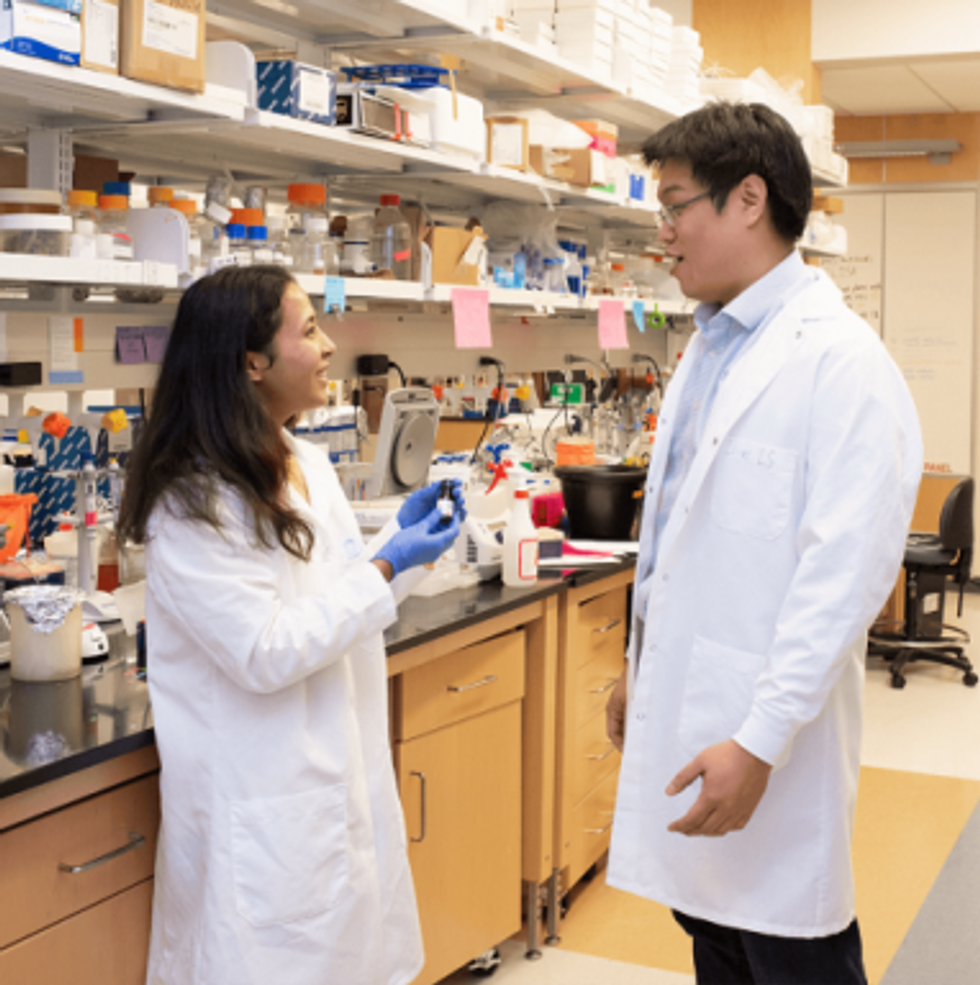
Suruchi Shrestha works in the lab with a colleague. In 2016, her research on antibodies for birth control was inspired by her own experience with side effects from an implanted hormonal IUD.
UNC - Chapel Hill
The sperm stays right where it met the antibody, never reaching the egg for fertilization. Eventually, and naturally, “Our vaginal system will just flush it out,” Shrestha explains.
“She showed in her early studies that [she] definitely got the sperm immotile, so they didn't move. And that was a really promising start,” says Jasmine Edelstein, a scientist with an expertise in antibody engineering who was not involved in this research. Shrestha’s team at UNC reproduced the effect in the sheep, notes Edelstein, who works at the startup Be Biopharma. In fact, Shrestha’s anti-sperm antibodies that caused the sperm to agglutinate, or clump together, were 99.9% effective when delivered topically to the sheep’s reproductive tracts.
The future
Going forward, Shrestha thinks the ideal approach would be delivering the antibodies through a vaginal ring. “We want to use it at the source of the spark,” Shrestha says, as opposed to less direct methods, such as taking a pill. The ring would dissolve after one month, she explains, “and then you get another one.”
Engineered to have a long shelf life, the anti-sperm antibody ring could be purchased without a prescription, and women could insert it themselves, without a doctor. “That's our hope, so that it is accessible,” Shrestha says. “Anybody can just go and grab it and not worry about pregnancy or unintended pregnancy.”
Her patented research has been licensed by several biotech companies for clinical trials. A number of Shrestha’s co-authors, including her lab advisor, Sam Lai, have launched a company, Mucommune, to continue developing the contraceptives based on these antibodies.
And, results from a small clinical trial run by researchers at Boston University Chobanian & Avedisian School of Medicine show that a dissolvable vaginal film with antibodies was safe when tested on healthy women of reproductive age. That same group of researchers last year received a $7.2 million grant from the National Institute of Health for further research on monoclonal antibody-based contraceptives, which have also been shown to block transmission of viruses, like HIV.
“As the costs come down, this becomes a more realistic option potentially for women,” says Edelstein. “The impact could be tremendous.”
This article was first published by Leaps.org in December, 2022. It has been lightly edited with updates for timeliness.