
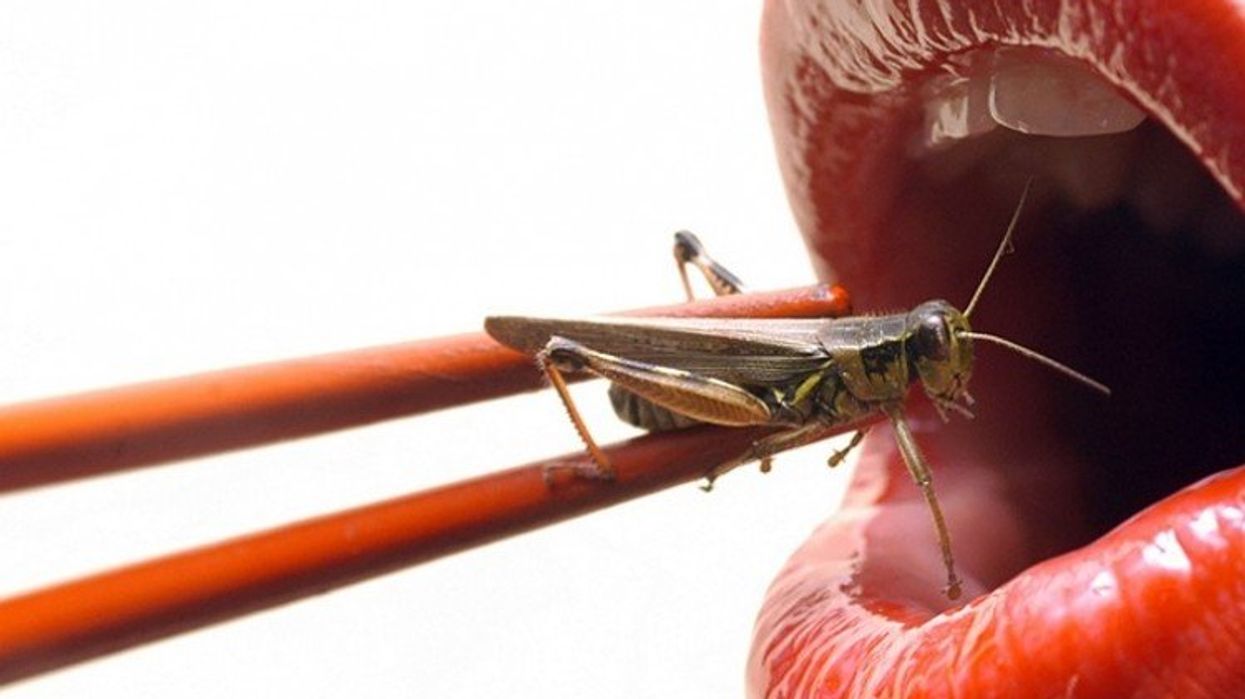
Crickets are low on fat, high on protein, and can be farmed sustainably. They are also crunchy.
Listen on Apple | Listen on Spotify | Listen on Stitcher | Listen on Amazon | Listen on Google
Further reading:
More info on Bicky Nguyen
https://yseali.fulbright.edu.vn/en/faculty/bicky-n...
The environmental footprint of beef production
https://www.earthsave.org/environment.htm
https://www.watercalculator.org/news/articles/beef-king-big-water-footprints/
https://www.frontiersin.org/articles/10.3389/fsufs.2019.00005/full
https://ourworldindata.org/carbon-footprint-food-methane
Insect farming as a source of sustainable protein
https://www.insectgourmet.com/insect-farming-growing-bugs-for-protein/
https://www.sciencedirect.com/topics/agricultural-and-biological-sciences/insect-farming
Cricket flour is taking the world by storm
https://www.cricketflours.com/
https://talk-commerce.com/blog/what-brands-use-cricket-flour-and-why/

Artificial Intelligence is already helping to grow some of the food we eat.
The chef-farmers choose from among 45 types of herb and leafy-greens seeds, plop them into grow trays, and a few weeks later they pick and serve. While success is predicated on at least a small amount of these humans’ care, the systems are autonomously surveilled round-the-clock from Babylon’s base of operations. And artificial intelligence is helping to run the show.
Babylon piloted the use of specialized cameras that take pictures in different spectrums to gather some less-obvious visual data about plants’ wellbeing and alert people if something seems off.
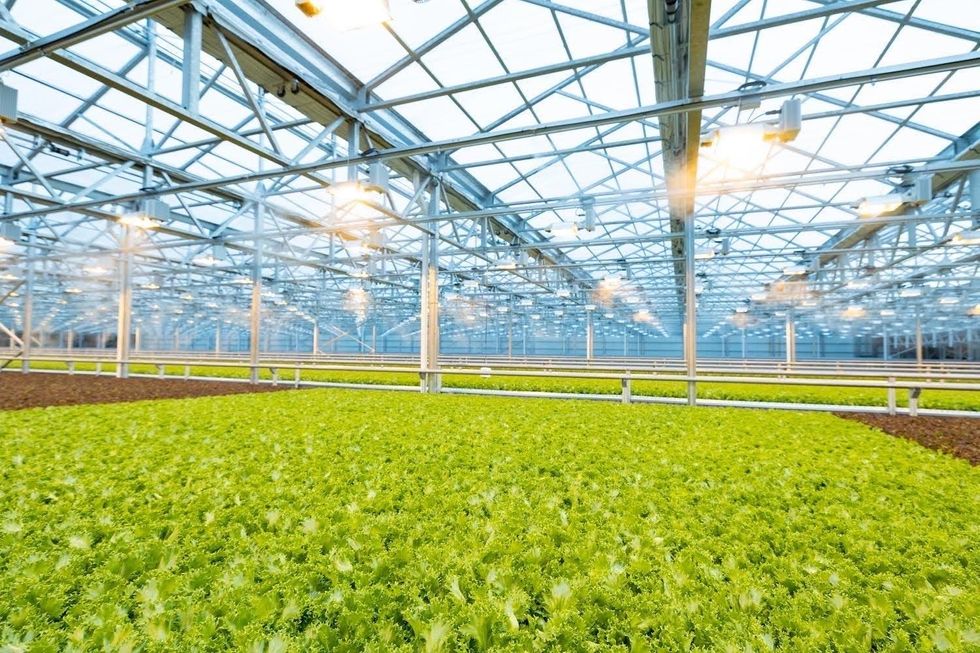
Imagine consistently perfect greens and tomatoes and strawberries, grown hyper-locally, using less water, without chemicals or environmental contaminants. This is the hefty promise of controlled environment agriculture (CEA) — basically, indoor farms that can be hydroponic, aeroponic (plant roots are suspended and fed through misting), or aquaponic (where fish play a role in fertilizing vegetables). But whether they grow 4,160 leafy-green servings per year, like one Babylon farm, or millions of servings, like some of the large, centralized facilities starting to supply supermarkets across the U.S., they seek to minimize failure as much as possible.
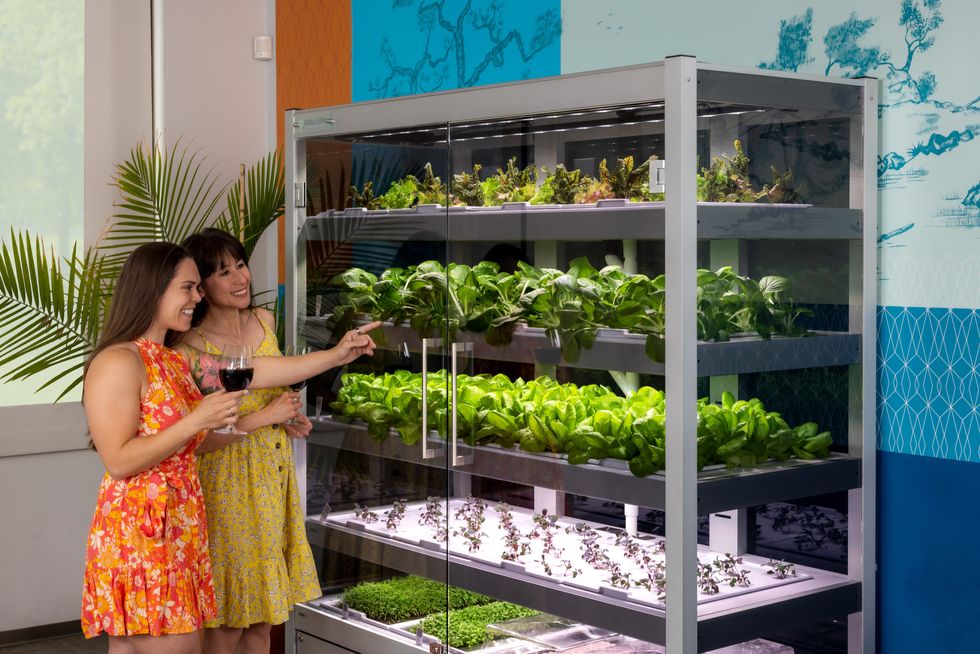
Babylon’s soilless hydroponic growing system
Courtesy Babylon Micro-Farms
Here, AI is starting to play a pivotal role. CEA growers use it to help “make sense of what’s happening” to the plants in their care, says Scott Lowman, vice president of applied research at the Institute for Advanced Learning and Research (IALR) in Virginia, a state that’s investing heavily in CEA companies. And although these companies say they’re not aiming for a future with zero human employees, AI is certainly poised to take a lot of human farming intervention out of the equation — for better and worse.
Most of these companies are compiling their own data sets to identify anything that might block the success of their systems. Babylon had already integrated sensor data into its farms to measure heat and humidity, the nutrient content of water, and the amount of light plants receive. Last year, they got a National Science Foundation grant that allowed them to pilot the use of specialized cameras that take pictures in different spectrums to gather some less-obvious visual data about plants’ wellbeing and alert people if something seems off. “Will this plant be healthy tomorrow? Are there things…that the human eye can't see that the plant starts expressing?” says Amandeep Ratte, the company’s head of data science. “If our system can say, Hey, this plant is unhealthy, we can reach out to [users] preemptively about what they’re doing wrong, or is there a disease at the farm?” Ratte says. The earlier the better, to avoid crop failures.
Natural light accounts for 70 percent of Greenswell Growers’ energy use on a sunny day.
Courtesy Greenswell Growers
IALR’s Lowman says that other CEA companies are developing their AI systems to account for the different crops they grow — lettuces come in all shapes and sizes, after all, and each has different growing needs than, for example, tomatoes. The ways they run their operations differs also. Babylon is unusual in its decentralized structure. But centralized growing systems with one main location have variabilities, too. AeroFarms, which recently declared bankruptcy but will continue to run its 140,000-square foot vertical operation in Danville, Virginia, is entirely enclosed and reliant on the intense violet glow of grow lights to produce microgreens.
Different companies have different data needs. What data is essential to AeroFarms isn’t quite the same as for Greenswell Growers located in Goochland County, Virginia. Raising four kinds of lettuce in a 77,000-square-foot automated hydroponic greenhouse, the vagaries of naturally available light, which accounts for 70 percent of Greenswell’s energy use on a sunny day, affect operations. Their tech needs to account for “outside weather impacts,” says president Carl Gupton. “What adjustments do we have to make inside of the greenhouse to offset what's going on outside environmentally, to give that plant optimal conditions? When it's 85 percent humidity outside, the system needs to do X, Y and Z to get the conditions that we want inside.”
AI will help identify diseases, as well as when a plant is thirsty or overly hydrated, when it needs more or less calcium, phosphorous, nitrogen.
Nevertheless, every CEA system has the same core needs — consistent yield of high quality crops to keep up year-round supply to customers. Additionally, “Everybody’s got the same set of problems,” Gupton says. Pests may come into a facility with seeds. A disease called pythium, one of the most common in CEA, can damage plant roots. “Then you have root disease pressures that can also come internally — a change in [growing] substrate can change the way the plant performs,” Gupton says.
AI will help identify diseases, as well as when a plant is thirsty or overly hydrated, when it needs more or less calcium, phosphorous, nitrogen. So, while companies amass their own hyper-specific data sets, Lowman foresees a time within the next decade “when there will be some type of [open-source] database that has the most common types of plant stress identified” that growers will be able to tap into. Such databases will “create a community and move the science forward,” says Lowman.
In fact, IALR is working on assembling images for just such a database now. On so-called “smart tables” inside an Institute lab, a team is growing greens and subjects them to various stressors. Then, they’re administering treatments while taking images of every plant every 15 minutes, says Lowman. Some experiments generate 80,000 images; the challenge lies in analyzing and annotating the vast trove of them, marking each one to reflect outcome—for example increasing the phosphate delivery and the plant’s response to it. Eventually, they’ll be fed into AI systems to help them learn.
For all the enthusiasm surrounding this technology, it’s not without downsides. Training just one AI system can emit over 250,000 pounds of carbon dioxide, according to MIT Technology Review. AI could also be used “to enhance environmental benefit for CEA and optimize [its] energy consumption,” says Rozita Dara, a computer science professor at the University of Guelph in Canada, specializing in AI and data governance, “but we first need to collect data to measure [it].”
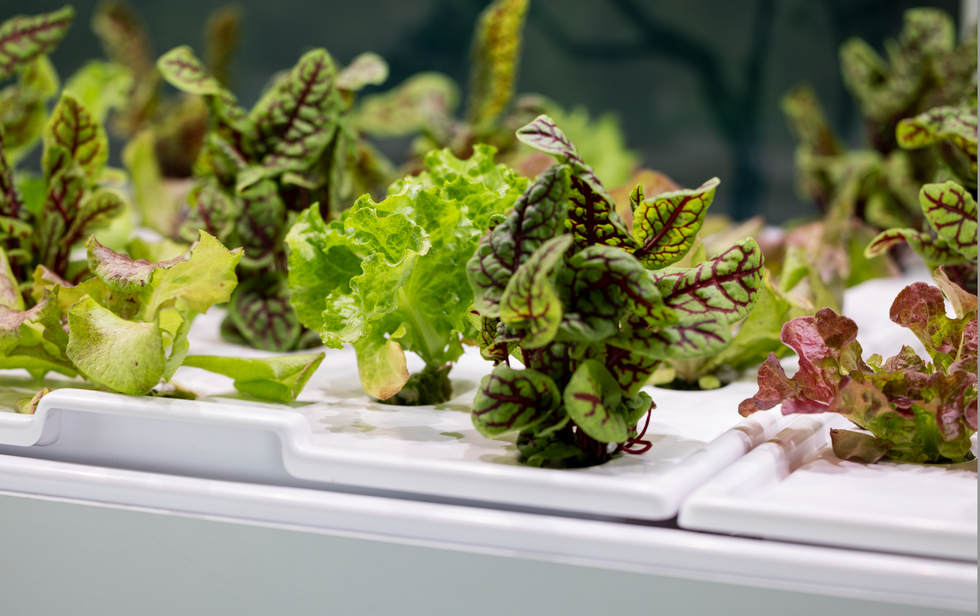
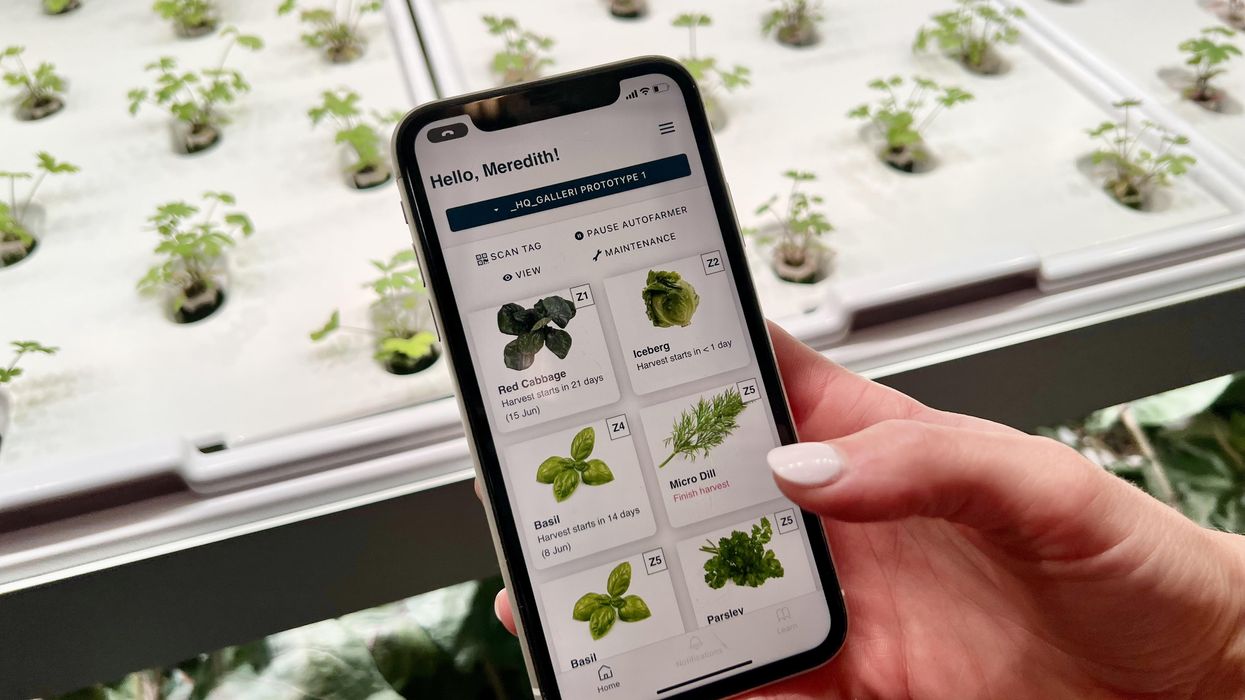
The chef-farmers can choose from 45 types of herb and leafy-greens seeds.
Courtesy Babylon Micro-Farms
Any system connected to the Internet of Things is also vulnerable to hacking; if CEA grows to the point where “there are many of these similar farms, and you're depending on feeding a population based on those, it would be quite scary,” Dara says. And there are privacy concerns, too, in systems where imaging is happening constantly. It’s partly for this reason, says Babylon’s Ratte, that the company’s in-farm cameras all “face down into the trays, so the only thing [visible] is pictures of plants.”
Tweaks to improve AI for CEA are happening all the time. Greenswell made its first harvest in 2022 and now has annual data points they can use to start making more intelligent choices about how to feed, water, and supply light to plants, says Gupton. Ratte says he’s confident Babylon’s system can already “get our customers reliable harvests. But in terms of how far we have to go, it's a different problem,” he says. For example, if AI could detect whether the farm is mostly empty—meaning the farm’s user hasn’t planted a new crop of greens—it can alert Babylon to check “what's going on with engagement with this user?” Ratte says. “Do they need more training? Did the main person responsible for the farm quit?”
Lowman says more automation is coming, offering greater ability for systems to identify problems and mitigate them on the spot. “We still have to develop datasets that are specific, so you can have a very clear control plan, [because] artificial intelligence is only as smart as what we tell it, and in plant science, there's so much variation,” he says. He believes AI’s next level will be “looking at those first early days of plant growth: when the seed germinates, how fast it germinates, what it looks like when it germinates.” Imaging all that and pairing it with AI, “can be a really powerful tool, for sure.”