

Centenarians essentially won the genetic lottery, says Nir Barzilai of Albert Einstein College of Medicine. He is studying their genes to see how the rest of us can benefit from understanding how they work.
Listen on Apple | Listen on Spotify | Listen on Stitcher | Listen on Amazon | Listen on Google
Centenarians may have essentially won the genetic lottery, but that doesn’t mean the rest of us are predestined to have a specific lifespan and health span, or the amount of time spent living productively and enjoyably. “Aging is a mother of all diseases,” Dr. Barzilai told me. And as a disease, it can be targeted by therapeutics. Dr. Barzilai’s team is already running clinical trials on such therapeutics — and the results are promising.
More about Dr. Barzilai: He is scientific director of AFAR, American Federation for Aging Research. As part of his work, Dr. Barzilai studies families of centenarians and their genetics to learn how the rest of us can learn and benefit from their super-aging. He also organizing a clinical trial to test a specific drug that may slow aging.
Show Links
Age Later: Health Span, Life Span, and the New Science of Longevity https://www.amazon.com/Age-Later-Healthiest-Sharpest-Centenarians/dp/1250230853
American Federation for Aging Research https://www.afar.org
https://www.afar.org/nir-barzilai
https://www.einsteinmed.edu/faculty/484/nir-barzilai/
Metformin as a Tool to Target Aging
https://www.ncbi.nlm.nih.gov/pmc/articles/PMC5943638/
Benefits of Metformin in Attenuating the Hallmarks of Aging https://www.ncbi.nlm.nih.gov/pmc/articles/PMC7347426/
The Longevity Genes Project https://www.einsteinmed.edu/centers/aging/longevity-genes-project/
Often called the window to the soul, the eyes are more sacred than other body parts, at least for some.
Eye transplants are desperately needed, but they're nowhere in sight. About 12.7 million people worldwide need a corneal transplant, which means that only one in 70 people who require them, get them. The gaps are international. Eye banks in the United Kingdom are around 20 percent below the level needed to supply hospitals, while Indian eye banks, which need at least 250,000 corneas per year, collect only around 45 to 50 thousand donor corneas (and of those 60 to 70 percent are successfully transplanted).
As for retinas, it's impossible currently to put one into the eye of another person. Artificial devices can be implanted to restore the sight of patients suffering from severe retinal diseases, but the number of people around the world with such “bionic eyes” is less than 600, while in America alone 11 million people have some type of retinal disease leading to severe vision loss. Add to this an increasingly aging population, commonly facing various vision impairments, and you have a recipe for heavy burdens on individuals, the economy and society. In the U.S. alone, the total annual economic impact of vision problems was $51.4 billion in 2017.
Even if you try growing tissues in the petri dish route into organoids mimicking the function of the human eye, you will not get the physiological complexity of the structure and metabolism of the real thing, according to Cosma. She is a member of a scientific consortium that includes researchers from major institutions from Spain, the U.K., Portugal, Italy and Israel. The consortium has received about $3.8 million from the European Union to pursue innovative eye research. Her team’s goal is to give hope to at least 2.2 billion people across the world afflicted with a vision impairment and 33 million who go through life with avoidable blindness.
Their method? Resuscitating cadaveric eyes for at least a month.
If we succeed, it will be the first intact human model of the eye capable of exploring and analyzing regenerative processes ex vivo. -- Maria Pia Cosma.
“We proposed to resuscitate eyes, that is to restore the global physiology and function of human explanted tissues,” Cosma said, referring to living tissues extracted from the eye and placed in a medium for culture. Their ECaBox is an ex vivo biological system, in which eyes taken from dead donors are placed in an artificial environment, designed to preserve the eye’s temperature and pH levels, deter blood clots, and remove the metabolic waste and toxins that would otherwise spell their demise.
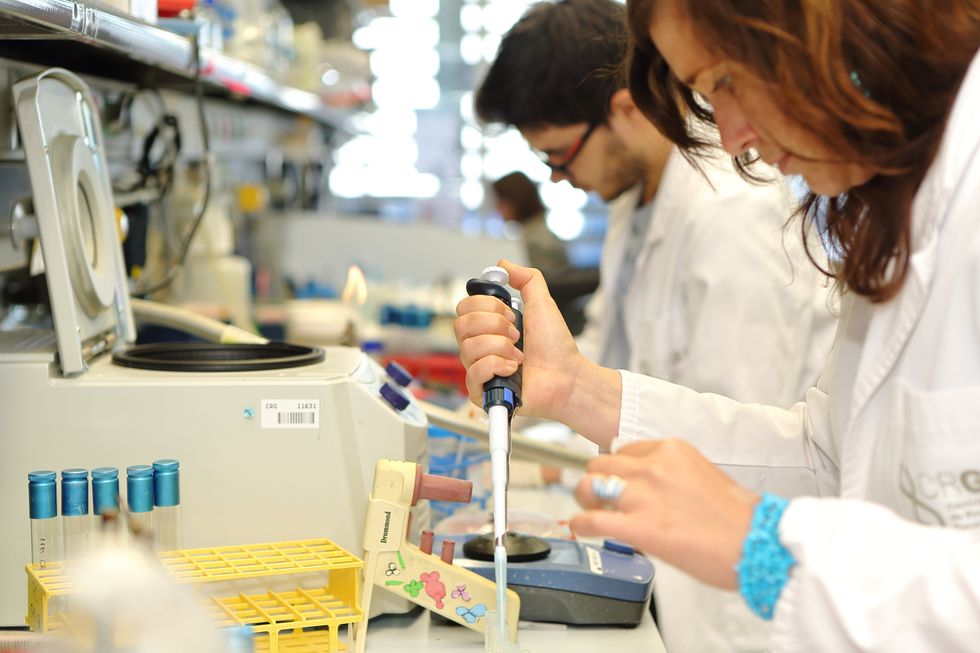
Scientists work on resuscitating eyes in the lab of Maria Pia Cosma.
Courtesy of Maria Pia Cosma.
“One of the great challenges is the passage of the blood in the capillary branches of the eye, what we call long-term perfusion,” Cosma said. Capillaries are an intricate network of very thin blood vessels that transport blood, nutrients and oxygen to cells in the body’s organs and systems. To maintain the garland-shaped structure of this network, sufficient amounts of oxygen and nutrients must be provided through the eye circulation and microcirculation. “Our ambition is to combine perfusion of the vessels with artificial blood," along with using a synthetic form of vitreous, or the gel-like fluid that lets in light and supports the the eye's round shape, Cosma said.
The scientists use this novel setup with the eye submersed in its medium to keep the organ viable, so they can test retinal function. “If we succeed, we will ensure full functionality of a human organ ex vivo. It will be the first intact human model of the eye capable of exploring and analyzing regenerative processes ex vivo,” Cosma added.
A rapidly developing field of regenerative medicine aims to stimulate the body's natural healing processes and restore or replace damaged tissues and organs. But for people with retinal diseases, regenerative medicine progress has been painfully slow. “Experiments on rodents show progress, but the risks for humans are unacceptable,” Cosma said.
The ECaBox could boost progress with regenerative medicine for people with retinal diseases, which has been painfully slow because human experiments involving their eyes are too risky. “We will test emerging treatments while reducing animal research, and greatly accelerate the discovery and preclinical research phase of new possible treatments for vision loss at significantly reduced costs,” Cosma explained. Much less time and money would be wasted during the drug discovery process. Their work may even make it possible to transplant the entire eyeball for those who need it.
“It is a very exciting project,” said Sanjay Sharma, a professor of ophthalmology and epidemiology at Queen's University, in Kingston, Canada. “The ability to explore and monitor regenerative interventions will increasingly be of importance as we develop therapies that can regenerate ocular tissues, including the retina.”
Seemingly, there's no sacred religious text or a holy book prohibiting the practice of eye donation.
But is the world ready for eye transplants? “People are a bit weird or very emotional about donating their eyes as compared to other organs,” Cosma said. And much can be said about the problem of eye donor shortage. Concerns include disfigurement and healthcare professionals’ fear that the conversation about eye donation will upset the departed person’s relatives because of cultural or religious considerations. As just one example, Sharma noted the paucity of eye donations in his home country, Canada.
Yet, experts like Sharma stress the importance of these donations for both the recipients and their family members. “It allows them some psychological benefit in a very difficult time,” he said. So why are global eye banks suffering? Is it because the eyes are the windows to the soul?
Seemingly, there's no sacred religious text or a holy book prohibiting the practice of eye donation. In fact, most major religions of the world permit and support organ transplantation and donation, and by extension eye donation, because they unequivocally see it as an “act of neighborly love and charity.” In Hinduism, the concept of eye donation aligns with the Hindu principle of daan or selfless giving, where individuals donate their organs or body after death to benefit others and contribute to society. In Islam, eye donation is a form of sadaqah jariyah, a perpetual charity, as it can continue to benefit others even after the donor's death.
Meanwhile, Buddhist masters teach that donating an organ gives another person the chance to live longer and practice dharma, the universal law and order, more meaningfully; they also dismiss misunderstandings of the type “if you donate an eye, you’ll be born without an eye in the next birth.” And Christian teachings emphasize the values of love, compassion, and selflessness, all compatible with organ donation, eye donation notwithstanding; besides, those that will have a house in heaven, will get a whole new body without imperfections and limitations.
The explanation for people’s resistance may lie in what Deepak Sarma, a professor of Indian religions and philosophy at Case Western Reserve University in Cleveland, calls “street interpretation” of religious or spiritual dogmas. Consider the mechanism of karma, which is about the causal relation between previous and current actions. “Maybe some Hindus believe there is karma in the eyes and, if the eye gets transplanted into another person, they will have to have that karmic card from now on,” Sarma said. “Even if there is peculiar karma due to an untimely death–which might be interpreted by some as bad karma–then you have the karma of the recipient, which is tremendously good karma, because they have access to these body parts, a tremendous gift,” Sarma said. The overall accumulation is that of good karma: “It’s a beautiful kind of balance,” Sarma said.
For the Jews, Christians, and Muslims who believe in the physical resurrection of the body that will be made new in an afterlife, the already existing body is sacred since it will be the basis of a new refashioned body in an afterlife.---Omar Sultan Haque.
With that said, Sarma believes it is a fallacy to personify or anthropomorphize the eye, which doesn’t have a soul, and stresses that the karma attaches itself to the soul and not the body parts. But for scholars like Omar Sultan Haque—a psychiatrist and social scientist at Harvard Medical School, investigating questions across global health, anthropology, social psychology, and bioethics—the hierarchy of sacredness of body parts is entrenched in human psychology. You cannot equate the pinky toe with the face, he explained.
“The eyes are the window to the soul,” Haque said. “People have a hierarchy of body parts that are considered more sacred or essential to the self or soul, such as the eyes, face, and brain.” In his view, the techno-utopian transhumanist communities (especially those in Silicon Valley) have reduced the totality of a person to a mere material object, a “wet robot” that knows no sacredness or hierarchy of human body parts. “But for the Jews, Christians, and Muslims who believe in the physical resurrection of the body that will be made new in an afterlife, the [already existing] body is sacred since it will be the basis of a new refashioned body in an afterlife,” Haque said. “You cannot treat the body like any old material artifact, or old chair or ragged cloth, just because materialistic, secular ideologies want so,” he continued.
For Cosma and her peers, however, the very definition of what is alive or not is a bit semantic. “As soon as we die, the electrophysiological activity in the eye stops,” she said. “The goal of the project is to restore this activity as soon as possible before the highly complex tissue of the eye starts degrading.” Cosma’s group doesn’t yet know when they will be able to keep the eyes alive and well in the ECaBox, but the consensus is that the sooner the better. Hopefully, the taboos and fears around the eye donations will dissipate around the same time.