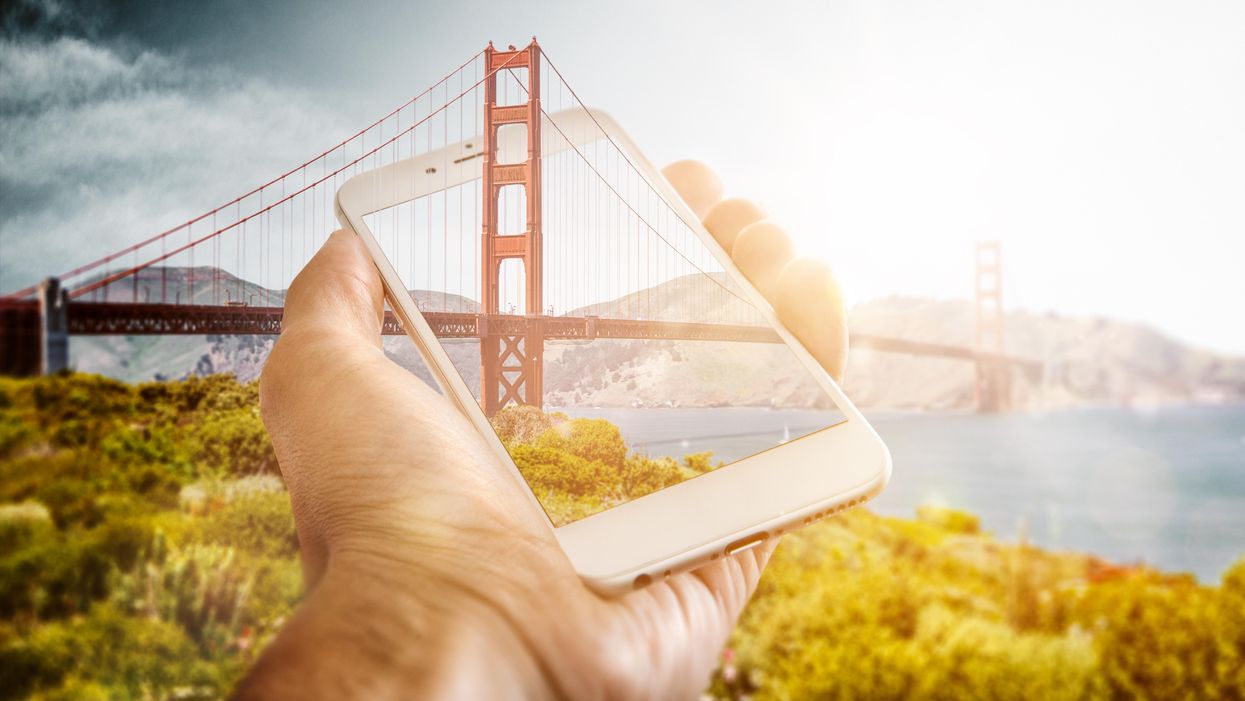
Scientists Are Building an “AccuWeather” for Germs to Predict Your Risk of Getting the Flu
Applied mathematician Sara del Valle works at the U.S.'s foremost nuclear weapons lab: Los Alamos. Once colloquially called Atomic City, it's a hidden place 45 minutes into the mountains northwest of Santa Fe. Here, engineers developed the first atomic bomb.
Like AccuWeather, an app for disease prediction could help people alter their behavior to live better lives.
Today, Los Alamos still a small science town, though no longer a secret, nor in the business of building new bombs. Instead, it's tasked with, among other things, keeping the stockpile of nuclear weapons safe and stable: not exploding when they're not supposed to (yes, please) and exploding if someone presses that red button (please, no).
Del Valle, though, doesn't work on any of that. Los Alamos is also interested in other kinds of booms—like the explosion of a contagious disease that could take down a city. Predicting (and, ideally, preventing) such epidemics is del Valle's passion. She hopes to develop an app that's like AccuWeather for germs: It would tell you your chance of getting the flu, or dengue or Zika, in your city on a given day. And like AccuWeather, it could help people alter their behavior to live better lives, whether that means staying home on a snowy morning or washing their hands on a sickness-heavy commute.
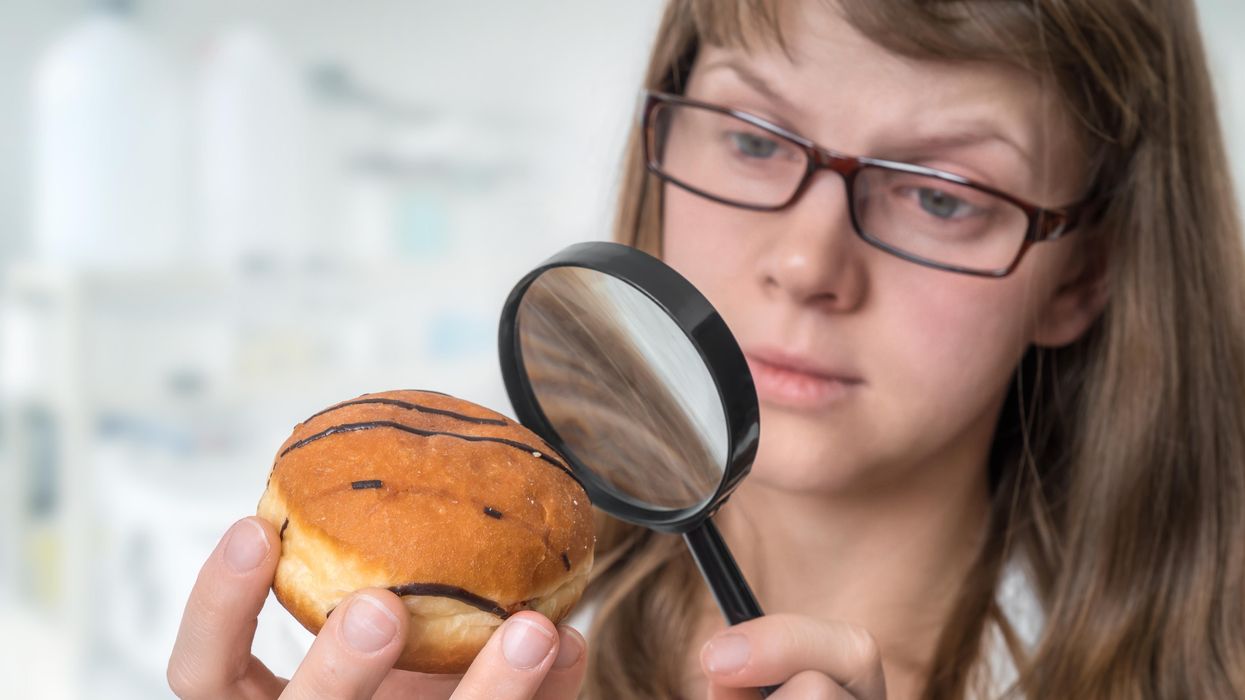
Sara del Valle of Los Alamos is working to predict and prevent epidemics using data and machine learning.
Since the beginning of del Valle's career, she's been driven by one thing: using data and predictions to help people behave practically around pathogens. As a kid, she'd always been good at math, but when she found out she could use it to capture the tentacular spread of disease, and not just manipulate abstractions, she was hooked.
When she made her way to Los Alamos, she started looking at what people were doing during outbreaks. Using social media like Twitter, Google search data, and Wikipedia, the team started to sift for trends. Were people talking about hygiene, like hand-washing? Or about being sick? Were they Googling information about mosquitoes? Searching Wikipedia for symptoms? And how did those things correlate with the spread of disease?
It was a new, faster way to think about how pathogens propagate in the real world. Usually, there's a 10- to 14-day lag in the U.S. between when doctors tap numbers into spreadsheets and when that information becomes public. By then, the world has moved on, and so has the disease—to other villages, other victims.
"We found there was a correlation between actual flu incidents in a community and the number of searches online and the number of tweets online," says del Valle. That was when she first let herself dream about a real-time forecast, not a 10-days-later backcast. Del Valle's group—computer scientists, mathematicians, statisticians, economists, public health professionals, epidemiologists, satellite analysis experts—has continued to work on the problem ever since their first Twitter parsing, in 2011.
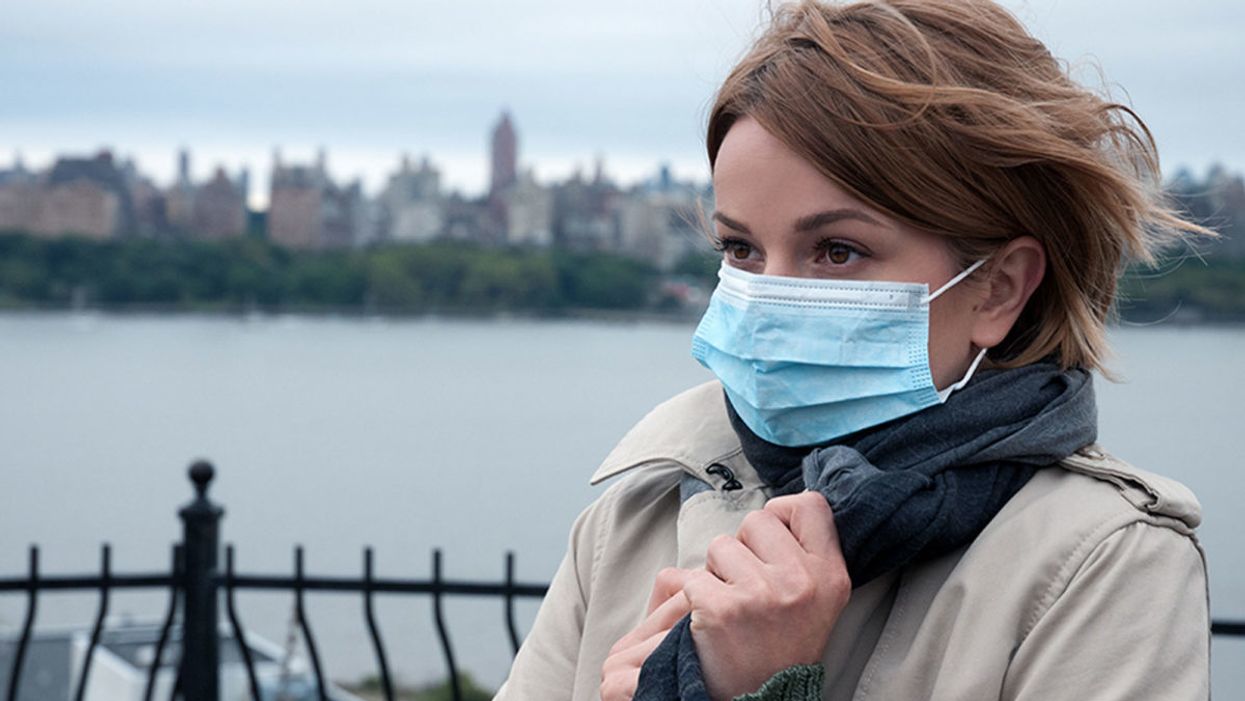
They've had their share of outbreaks to track. Looking back at the 2009 swine flu pandemic, they saw people buying face masks and paying attention to the cleanliness of their hands. "People were talking about whether or not they needed to cancel their vacation," she says, and also whether pork products—which have nothing to do with swine flu—were safe to buy.
At the latest meeting with all the prediction groups, del Valle's flu models took first and second place.
They watched internet conversations during the measles outbreak in California. "There's a lot of online discussion about anti-vax sentiment, and people trying to convince people to vaccinate children and vice versa," she says.
Today, they work on predicting the spread of Zika, Chikungunya, and dengue fever, as well as the plain old flu. And according to the CDC, that latter effort is going well.
Since 2015, the CDC has run the Epidemic Prediction Initiative, a competition in which teams like de Valle's submit weekly predictions of how raging the flu will be in particular locations, along with other ailments occasionally. Michael Johannson is co-founder and leader of the program, which began with the Dengue Forecasting Project. Its goal, he says, was to predict when dengue cases would blow up, when previously an area just had a low-level baseline of sick people. "You'll get this massive epidemic where all of a sudden, instead of 3,000 to 4,000 cases, you have 20,000 cases," he says. "They kind of come out of nowhere."
But the "kind of" is key: The outbreaks surely come out of somewhere and, if scientists applied research and data the right way, they could forecast the upswing and perhaps dodge a bomb before it hit big-time. Questions about how big, when, and where are also key to the flu.
A big part of these projects is the CDC giving the right researchers access to the right information, and the structure to both forecast useful public-health outcomes and to compare how well the models are doing. The extra information has been great for the Los Alamos effort. "We don't have to call departments and beg for data," says del Valle.
When data isn't available, "proxies"—things like symptom searches, tweets about empty offices, satellite images showing a green, wet, mosquito-friendly landscape—are helpful: You don't have to rely on anyone's health department.
At the latest meeting with all the prediction groups, del Valle's flu models took first and second place. But del Valle wants more than weekly numbers on a government website; she wants that weather-app-inspired fortune-teller, incorporating the many diseases you could get today, standing right where you are. "That's our dream," she says.
This plot shows the the correlations between the online data stream, from Wikipedia, and various infectious diseases in different countries. The results of del Valle's predictive models are shown in brown, while the actual number of cases or illness rates are shown in blue.
(Courtesy del Valle)
The goal isn't to turn you into a germophobic agoraphobe. It's to make you more aware when you do go out. "If you know it's going to rain today, you're more likely to bring an umbrella," del Valle says. "When you go on vacation, you always look at the weather and make sure you bring the appropriate clothing. If you do the same thing for diseases, you think, 'There's Zika spreading in Sao Paulo, so maybe I should bring even more mosquito repellent and bring more long sleeves and pants.'"
They're not there yet (don't hold your breath, but do stop touching your mouth). She estimates it's at least a decade away, but advances in machine learning could accelerate that hypothetical timeline. "We're doing baby steps," says del Valle, starting with the flu in the U.S., dengue in Brazil, and other efforts in Colombia, Ecuador, and Canada. "Going from there to forecasting all diseases around the globe is a long way," she says.
But even AccuWeather started small: One man began predicting weather for a utility company, then helping ski resorts optimize their snowmaking. His influence snowballed, and now private forecasting apps, including AccuWeather's, populate phones across the planet. The company's progression hasn't been without controversy—privacy incursions, inaccuracy of long-term forecasts, fights with the government—but it has continued, for better and for worse.
Disease apps, perhaps spun out of a small, unlikely team at a nuclear-weapons lab, could grow and breed in a similar way. And both the controversies and public-health benefits that may someday spin out of them lie in the future, impossible to predict with certainty.
Your phone could show if a bridge is about to collapse
In summer 2017, Thomas Matarazzo, then a postdoctoral researcher at the Massachusetts Institute of Technology, landed in San Francisco with a colleague. They rented two cars, drove up to the Golden Gate bridge, timing it to the city’s rush hour, and rode over to the other side in heavy traffic. Once they reached the other end, they turned around and did it again. And again. And again.
“I drove over that bridge 100 times over five days, back and forth,” says Matarazzo, now an associate director of High-Performance Computing in the Center for Innovation in Engineering at the United States Military Academy, West Point. “It was surprisingly stressful, I never anticipated that. I had to maintain the speed of about 30 miles an hour when the speed limit is 45. I felt bad for everybody behind me.”
Matarazzo had to drive slowly because the quality of data they were collecting depended on it. The pair was designing and testing a new smartphone app that could gather data about the bridge’s structural integrity—a low-cost citizen-scientist alternative to the current industrial methods, which aren’t always possible, partly because they’re expensive and complex. In the era of aging infrastructure, when some bridges in the United States and other countries are structurally unsound to the point of collapsing, such an app could inform authorities about the need for urgent repairs, or at least prompt closing the most dangerous structures.
There are 619,588 bridges in the U.S., and some of them are very old. For example, the Benjamin Franklin Bridge connecting Philadelphia to Camden, N.J., is 96-years-old while the Brooklyn Bridge is 153. So it’s hardly surprising that many could use some upgrades. “In the U.S., a lot of them were built in the post-World War II period to accommodate the surge of motorization,” says Carlo Ratti, architect and engineer who directs the Senseable City Lab at Massachusetts Institute of Technology. “They are beginning to reach the end of their life.”
According to the 2022 American Road & Transportation Builders Association’s report, one in three U.S. bridges needs repair or replacement. The Department of Transportation (DOT) National Bridge Inventory (NBI) database reveals concerning numbers. Thirty-six percent of U.S. bridges need repair work and over 78,000 bridges should be replaced. More than 43,500 bridges are rated in poor condition and classified as “structurally deficient” – an alarming description. Yet, people drive over them 167.5 million times a day. The Pittsburgh bridge which collapsed in January this year—only hours before President Biden arrived to discuss the new infrastructure law—was on the “poor” rating list.
Assessing the structural integrity of a bridge is not an easy endeavor. Most of the time, these are visual inspections, Matarazzo explains. Engineers check cracks, rust and other signs of wear and tear. They also check for wildlife—birds which may build nests or even small animals that make homes inside the bridge structures, which can slowly chip at the structure. However, visual inspections may not tell the whole story. A more sophisticated and significantly more expensive inspection requires placing special sensors on the bridge that essentially listen to how the bridge vibrates.
“Some bridges can afford expensive sensors to do the job, but that comes at a very high cost—hundreds of thousands of dollars per bridge per year,” Ratti says.
We may think of bridges as immovable steel and concrete monoliths, but they naturally vibrate, oscillating slightly. That movement can be influenced by the traffic that passes over them, and even by wind. Bridges of different types vibrate differently—some have longer vibrational frequencies and others shorter ones. A good way to visualize this phenomenon is to place a ruler over the edge of a desk and flick it slightly. If the ruler protrudes far off the desk, it will vibrate slowly. But if you shorten the end that hangs off, it will vibrate much faster. It works similarly with bridges, except there are more factors at play, including not only the length, but also the design and the materials used.
The long suspension bridges such as the Golden Gate or Verrazano Narrows, which hang on a series of cables, are more flexible, and their vibration amplitudes are longer. The Golden Gate Bridge can vibrate at 0.106 Hertz, where one Hertz is one oscillation per second. “Think about standing on the bridge for about 10 seconds—that's how long it takes for it to move all the way up and all the way down in one oscillation,” Matarazzo says.
On the contrary, the concrete span bridges that rest on multiple columns like Brooklyn Bridge or Manhattan Bridge, are “stiffer” and have greater vibrational frequencies. A concrete bridge can have a frequency of 10 Hertz, moving 10 times in one second—like that shorter stretch of a ruler.
The special devices that can pick up and record these vibrations over time are called accelerometers. A network of these devices for each bridge can cost $20,000 to $50,000, and more—and require trained personnel to place them. The sensors also must stay on the bridge for some time to establish what’s a healthy vibrational baseline for a given bridge. Maintaining them adds to the cost. “Some bridges can afford expensive sensors to do the job, but that comes at a very high cost—hundreds of thousands of dollars per bridge per year,” Ratti says.
Making sense of the readouts they gather is another challenge, which requires a high level of technical expertise. “You generally need somebody, some type of expert capable of doing the analysis to translate that data into information,” says Matarazzo, which ticks up the price, so doing visual inspections often proves to be a more economical choice for state-level DOTs with tight budgets. “The existing systems work well, but have downsides,” Ratti says. The team thought the old method could use some modernizing.
Smartphones, which are carried by millions of people, contain dozens of sensors, including the accelerometers capable of picking up the bridges’ vibrations. That’s why Matarazzo and his colleague drove over the bridge 100 times—they were trying to pick up enough data. Timing it to rush hour supported that goal because traffic caused more “excitation,” Matarazzo explains. “Excitation is a big word we use when we talk about what drives the vibration,” he says. “When there's a lot of traffic, there's more excitation and more vibration.” They also collaborated with Uber, whose drivers made 72 trips across the bridge to gather data in different cars.
The next step was to clean the data from “noise”—various vibrations that weren’t relevant to the bridge but came from the cars themselves. “It could be jumps in speed, it could be potholes, it could be a bunch of other things," Matarazzo says. But as the team gathered more data, it became easier to tell the bridge vibrational frequencies from all others because the noises generated by cars, traffic and other things tend to “cancel out.”
The team specifically picked the Golden Gate bridge because the civil structural engineering community had studied it extensively over the years and collected a host of vibrational data, using traditional sensors. When the researchers compared their app-collected frequencies with those gathered by 240 accelerometers formerly placed on the Golden Gate, the results were the same—the data from the phones converged with that from the bridge’s sensors. The smartphone-collected data were just as good as those from industry devices.
The study authors estimate that officials could use crowdsourced data to make key improvements that would help new bridges to last about 14 years longer.
The team also tested their method on a different type of bridge—not a suspension one like the Golden Gate, but a concrete span bridge in Ciampino, Italy. There they compared 280 car trips over the bridge to the six sensors that had been placed on the bridge for seven months. The results were slightly less matching, but a larger volume of trips would fix the divergence, the researchers wrote in their study, titled Crowdsourcing bridge dynamic monitoring with smartphone vehicle trips, published last month in Nature Communications Engineering.
Although the smartphones proved effective, the app is not quite ready to be rolled out commercially for people to start using. “It is still a pilot version,” so there’s room for improvement, says Ratti, who co-authored the study. “But on a more optimistic note, it has really low barriers to entry—all you need is smartphones on cars—so that makes the system easy to reach a global audience.” And the study authors estimate that the use of crowdsourced data would result in a new bridge lasting about 14 years longer.
Matarazzo hopes that the app could be eventually accessible for your average citizen scientist to collect the data and supply it to their local transportation authorities. “I hope that this idea can spark a different type of relationship with infrastructure where people think about the data they're collecting as some type of contribution or investment into their communities,” he says. “So that they can help their own department of transportation, their own municipality to support that bridge and keep it maintained better, longer and safer.”
Lina Zeldovich has written about science, medicine and technology for Popular Science, Smithsonian, National Geographic, Scientific American, Reader’s Digest, the New York Times and other major national and international publications. A Columbia J-School alumna, she has won several awards for her stories, including the ASJA Crisis Coverage Award for Covid reporting, and has been a contributing editor at Nautilus Magazine. In 2021, Zeldovich released her first book, The Other Dark Matter, published by the University of Chicago Press, about the science and business of turning waste into wealth and health. You can find her on http://linazeldovich.com/ and @linazeldovich.
The Friday Five: Sugar could help catch cancer early
The Friday Five covers five stories in research that you may have missed this week. There are plenty of controversies and troubling ethical issues in science – and we get into many of them in our online magazine – but this news roundup focuses on scientific creativity and progress to give you a therapeutic dose of inspiration headed into the weekend.
Listen on Apple | Listen on Spotify | Listen on Stitcher | Listen on Amazon | Listen on Google
Here are the promising studies covered in this week's Friday Five:
- Catching cancer early could depend on sugar
- How to boost memory in a flash
- This is your brain on books
- A tiny sandwich cake could help the heart
- Meet the top banana for fighting Covid variants