

Q. We are sitting here in the so-called pop-up network state Zuzalu temporarily realized in the village of Lusticia Bay by the beautiful Mediterranean Sea. To me this is an entirely new concept: What is a network state?
A. A network state is a highly aligned online community that has a level of in-person civility; it crowd-funds territory, and it eventually seeks diplomatic recognition. In a way it's about starting a new country. The term was coined by the crypto influencer and former CTO of Coinbase Balaji Srinivasan in a book by the same title last year [2022]. What many people don't know is that it is a more recent addition or innovation in a space called competitive governance. The idea is that you have multiple jurisdictions competing to provide you services as a customer. When you have competition among governments or government service providers, these entities are forced to provide you with a better service instead of the often worse service at higher prices or higher taxes that we're currently getting. The idea went from seasteading, which was hardly feasible because of costs, to charter cities getting public/private partnerships with existing governments and a level of legal autonomy, to special economic zones, to now network states.
Q. How do network states compare to charter cities and similar jurisdictions?
A. Charter cities and special economic zones were legal forks from other existing states. Dubai, Shenzhen in China, to some degree Hong Kong, to some degree Singapore are some examples. There's a host of other charter cities, one of which I'm based in myself, which is Prospera located in Honduras on the island Roatán. Charter cities provide the full stack of governance; they provide new laws and regulations, business registration, tax codes and governance services, Estonia style: you log on to the government platform and you get services as a citizen.
When conceptualizing network states, Balagi Srinivasan turns the idea of a charter city a bit on its head: he doesn't want to start with this full stack because it's still very hard to get these kinds of partnerships with government. It's very expensive and requires lots of experience and lots of social capital. He is saying that network states could instead start as an online community. They could have a level of alignment where they trade with each other; they have their own economy; they meet in person in regular gatherings like we're doing here in Zuzulu for two months, and then they negotiate with existing governments or host cities to get a certain degree of legal autonomy that is centered around a moral innovation. So, his idea is: don't focus on building a completely new country or city; focus on a moral innovation.
Q. What would be an example of such a moral innovation?
A. An example would be longevity—life is good; death is bad—let's see what we can do to foster progress around that moral innovation and see how we can get legal forks from the existing system that allow us to accelerate progress in that area. There is an increasing realization in the science that there are hallmarks of aging and that aging is a cause of other diseases like cancer, ALS or Alzheimer's. But aging is not recognized as a disease by the FDA in the United States and in most countries around the world, so it's very hard to get scientific funding for biotechnology that would attack the hallmarks of aging and allow us potentially to reverse aging and extend life. This is a significant shortcoming of existing government systems that groups such as the ones that have come together here in Montenegro are now seeking alternatives too. Charter cities and now network states are such alternatives.
Q. Would it not be better to work within the current systems, and try to improve them, rather than abandon them for new experimental jurisdictions?
A. There are numerous failures of public policies. These failures are hard, if not impossible, to reverse, because as soon as you have these policies, you have entrenched interests who benefit from the regulations. The only way to disrupt incumbent industries is with start-ups, but the way the system is set up makes it excessively hard for such start-ups to become big companies. In fact, larger companies are weaponizing the legal system against small companies, because they can afford the lawyers and the fixed cost of compliance.
I don't believe that our institutions in many developed countries are beyond hope. I just think it's easier to change them if you could point at successful examples. ‘Hey, this country or this zone is already doing it very successfully’; if they can extend people’s lifespan by 10 years, if they can reduce maternal mortality, and if they have a massive medical tourism where people come back healthier, then that is just very embarrassing for the FDA.
Q. Perhaps a comparison here would be the relationship between Hong Kong and China?
A. Correct, so having Hong Kong right in front of your door … ‘Hey, this capitalism thing seems to work, why don't we try it here?’ It was due to the very bold leadership by Deng Xiaoping that they experimented with it in the development zone of Shenzhen. It worked really well and then they expanded with more special economic zones that also worked.
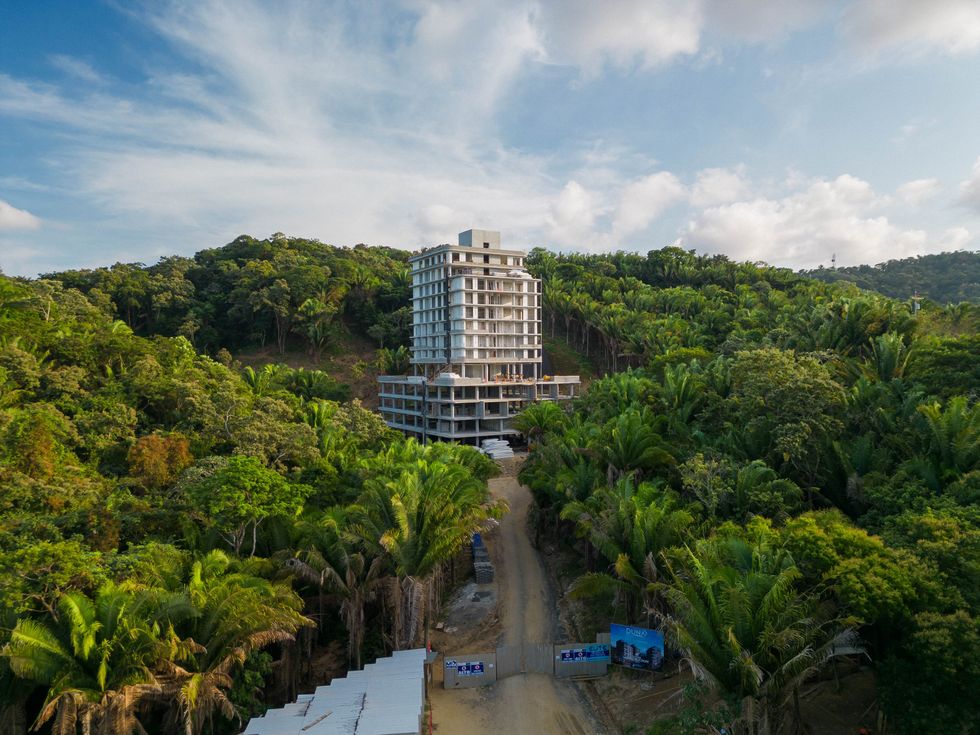
Próspera is a private city and special economic zone on the island of Roatán in the Central American state of Honduras.
Q. Tell us about Prospera, the charter city in Honduras, that you are intimately connected with.
A. Honduras is a very poor country. It has a lot of crime, never had a single VC investment, and has a GDP per capita of 2,000 per year. Honduras has suffered tremendously. The goal of these special economic zones is to bring in economic development. That's their sole purpose. It's a homegrown innovation from Honduras that started in 2009 with a very forward-thinking statesman, Octavio Sanchez, who was the chief of staff to the president of Honduras, and then president. He had his own ideas about making Honduras a more decentralized system, where more of the power lies in the municipalities.
Inspired by the ideas of Nobel laureate economist Paul Romer, who gave a famous Ted Talk in 2009 about charter cities, Sanchez initiated a process that lasted for years and eventually led to the creation of a special economic zone legal regime that’s anchored in the Hunduran constitution that provides the highest legal autonomy in the world to these zones. There are today three special economic zones approved by the Honduran government: Prospera, Ciudad Morazan and Orchidea.
Q. How did you become interested and then involved in Prospera?
A. I read about it first in an article by Scott Alexander, a famous rationalist blogger, who wrote a very long article about Prospera, and I thought, this is amazing! Then I came to Prospera and I found it to be one of the most if not the most exciting project in the world going on right now and that it also opened my heart to the country and its people. Most of my friends there are Honduran, they have been working on this for 10 or more years. They want to remake Honduras and put it on the map as the place in the world where this legal and governance innovation started.
Q. To what extent is Prospera autonomous relative to the Honduran government?
A. What's interesting about the Honduran model is that it's anchored within the Honduran constitution, and it has a very clear framework for what's possible and what's not possible, and what's possible ensures the highest degree of legal autonomy anywhere seen in the world. Prospera has really pushed the model furthest in creating a common law-based polycentric legal system. The idea is that you don't have a legislature, instead you have common law and it's based on the best practice common law principles that a legal scholar named Tom W. Bell created.
One of the core ideas is that as a business you're not obligated to follow one regulatory monopoly like the FDA. You have regulatory flexibility so you can choose what you're regulated under. So, you can say: ‘if I do a medical clinic, I do it under Norwegian law here’. And you even have the possibility to amend it a bit. You're still required to have liability insurance, and have to agree to binding arbitration in case there's a legal dispute. And your insurance has to approve you. So, under that model the insurance becomes the regulator and they regulate through prices. The limiting factor is criminal law; Honduran criminal law fully applies. So does immigration law. And we pay taxes.
Q. Is there also an idea of creating a kind of healthy living there, and encourage medical tourism?
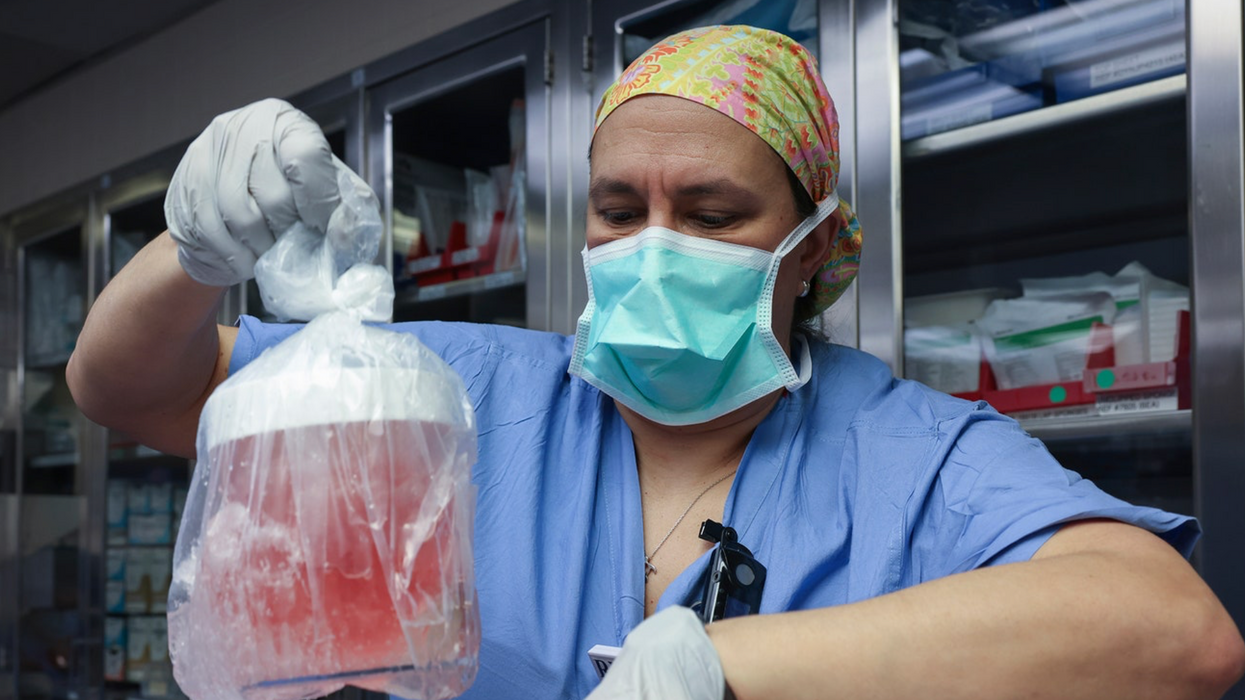
A. Yes, we specifically look for legal advantages in autonomy around creating new drugs, doing clinical trials, doing self-medication and experimentation. There is a stem cell clinic here and they're doing clinical trials. The island of Roatán is very easily accessible for American tourists. It's a beautiful island, and it's for regulatory reasons hard to do stem cell therapies in the United States, so they're flying in patients from the United States. Most of them are very savvy and often have PhDs in biotech and are able to assess the risk for themselves of taking drugs and doing clinical trials. We're also going to get a wellness center, and there have been ideas around establishing a peptide clinic and a compound pharmacy and things like that. We are developing a healthcare ecosystem.
Q. This kind of experimental tourism raises some ethical issues. What happens if patients are harmed? And what are the moral implications for society of these new treatments?
A. As a moral principle we believe in medical freedom: people have rights over their bodies, even at the (informed) risk of harm to themselves if no unconsenting third-parties are harmed; this is a fundamental right currently not protected effectively.
What we do differently is not changing ethical norms around safety and efficacy, we’re just changing the institutional setup. Instead of one centralized bureaucracy, like the FDA, we have regulatory pluralism that allows different providers of safety and efficacy to compete under market rules. Like under any legal system, common law in Prospera punishes malpractice, fraud, murder etc. This system will still produce safe and effective drugs, and it will still work with common sense legal notions like informed consent and liability for harm. There are regulations for medical practice, there is liability insurance and things like that. It will just do so more efficiently than the current way of doing things (unless it won’t, in which case it will change and evolve – or fail).
A direct moral benefit ´to what we do is that we increase accessibility. Typical gene therapies on the market cost $1 million dollars in the US. The gene therapy developed in Prospera costs $25,000. As to concern about whether such treatments are problematic, we do not share this perspective. We are for advancing science responsibly and we believe that both individuals and society stand to gain from improving the resiliency of the human body through advanced biotechnology.
Q. How does Prospera relate to the local Honduran population?
A. I think it's very important that our projects deliver local benefits and that they're well anchored in local communities. Because when you go to a new place, you're seen as a foreigner, and you're seen as potentially a danger or a threat. The most important thing for Prospera and Ciudad Morazan is to show we're creating jobs; we're creating employment; we're improving people's lives on the ground. Prospera is directly and indirectly employing 1,100 people. More than 2/3 of the people who are working for Prospera are Honduran. It has a lot of local service workers from the island, and it has educated Hondurans from the mainland for whom it's an alternative to going to the United States.
Q. What makes a good Prosperian citizen?
A. People in Prospera are very entrepreneurial. They're opening companies on a small scale. For example, Vehinia, who is the cook in the kitchen at Prospera, she's from the neighboring village and she started an NGO that is now funding a school where children from the local village can go to instead of a school that's 45 minutes away. There's very much a spirit of ‘let's exchange and trade with each other’. Some people might see that as a bit too commercial, but that's something about the culture that people accept and that people see as a good thing.
Q. Five years from now, if everything goes well, what do we see in Prospera?
A. I think Prospera will have at least 10,000 residents and I think Honduras hopefully will have more zones. There could be zones with a thriving industrial sector and sort of a labor-intensive economy and some that are very strong in pharmaceuticals, there could also be other zones for synthetic biology, and other zones focused on agriculture. The zones of Prospera, Ciudad Morazan and Orchidea are already showing the results we want to see, the results that we will eventually be measured by, and I'm tremendously excited about Honduras.