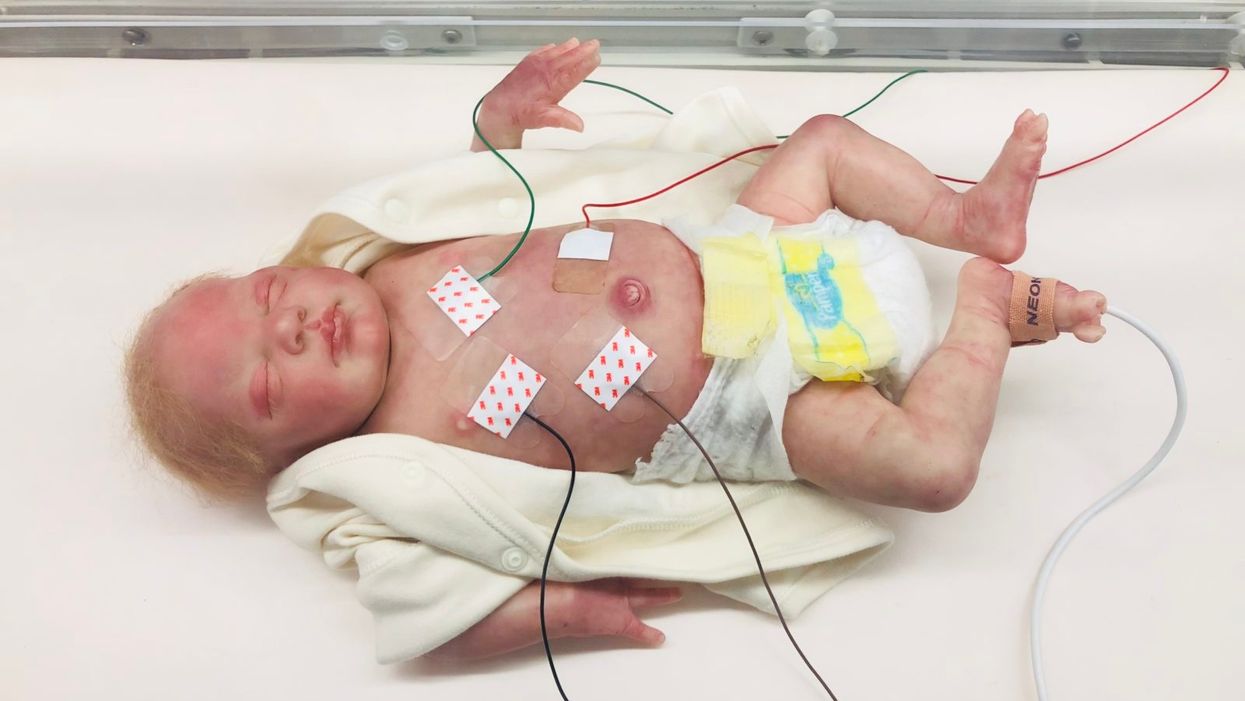
The Sickest Babies Are Covered in Wires. New Tech Is Changing That.

A wired baby in a neonatal intensive care unit.
I'll never forget the experience of having a child in the neonatal intensive care unit (NICU).
Now more than ever, we're working to remove the barriers between new parents and their infants.
It was another layer of uncertainty that filtered into my experience of being a first-time parent. There was so much I didn't know, and the wires attached to my son's small body for the first week of his life were a reminder of that.
I wanted to be the best mother possible. I deeply desired to bring my son home to start our lives. More than anything, I longed for a wireless baby whom I could hold and love freely without limitations.
The wires suggested my baby was fragile and it left me feeling severely unprepared, anxious, and depressed.
In recent years, research has documented the ways that NICU experiences take a toll on parents' mental health. But thankfully, medical technology is rapidly being developed to help reduce the emotional fallout of the NICU. Now more than ever, we're working to remove the barriers between new parents and their infants. The latest example is the first ever wireless monitoring system that was recently developed by a team at Northwestern University.
After listening to the needs of parents and medical staff, Debra Weese-Mayer, M.D., a professor of pediatric autonomic medicine at Feinberg School of Medicine, along with a team of materials scientists, engineers, dermatologists and pediatricians, set out to develop this potentially life-changing technology. Weese-Mayer believes wireless monitoring will have a significant impact for people on all sides of the NICU experience.
"With elimination of the cumbersome wires," she says, "the parents will find their infant more approachable/less intimidating and have improved access to their long-awaited but delivered-too-early infant, allowing them to begin skin-to-skin contact and holding with reduced concern for dislodging wires."
So how does the new system work?
Very thin "skin like" patches made of silicon rubber are placed on the surface of the skin to monitor vitals like heart rate, respiration rate, and body temperature. One patch is placed on the chest or back and the other is placed on the foot.
These patches are safer on the skin than previously used adhesives, reducing the cuts and infections associated with past methods. Finally, an antenna continuously delivers power, often from under the mattress.
The data collected from the patches stream from the body to a tablet or computer.

New wireless sensor technology is being studied to replace wired monitoring in NICUs in the coming years.
(Northwestern University)
Weese-Mayer hopes that wireless systems will be standard soon, but first they must undergo more thorough testing. "I would hope that in the next five years, wireless monitoring will be the standard in NICUs, but there are many essential validation steps before this technology will be embraced nationally," she says.
Until the new systems are ready, parents will be left struggling with the obstacles that wired monitoring presents.
Physical intimacy, for example, appears to have pain-reducing qualities -- something that is particularly important for babies who are battling serious illness. But wires make those cuddles more challenging.
There's also been minimal discussion about how wired monitoring can be particularly limiting for parents with disabilities and mobility aids, or even C-sections.
"When he was first born and I was recovering from my c-section, I couldn't deal with keeping the wires untangled while trying to sit down without hurting myself," says Rhiannon Giles, a writer from North Carolina, who delivered her son at just over 31 weeks after suffering from severe preeclampsia.
"The wires were awful," she remembers. "They fell off constantly when I shifted positions or he kicked a leg, which meant the monitors would alarm. It felt like an intrusion into the quiet little world I was trying to mentally create for us."
Over the last few years, researchers have begun to dive deeper into the literal and metaphorical challenges of wired monitoring.
For many parents, the wires prompt anxiety that worsens an already tense and vulnerable time.
I'll never forget the first time I got to hold my son without wires. It was the first time that motherhood felt manageable.
"Seeing my five-pound-babies covered in wires from head to toe rendered me completely overwhelmed," recalls Caila Smith, a mom of five from Indiana, whose NICU experience began when her twins were born pre-term. "The nurses seemed to handle them perfectly, but I was scared to touch them while they appeared so medically frail."
During the nine days it took for both twins to come home, the limited access she had to her babies started to impact her mental health. "If we would've had wireless sensors and monitors, it would've given us a much greater sense of freedom and confidence when snuggling our newborns," Smith says.
Besides enabling more natural interactions, wireless monitoring would make basic caregiving tasks much easier, like putting on a onesie.
"One thing I noticed is that many preemie outfits are made with zippers," points out Giles, "which just don't work well when your baby has wires coming off of them, head to toe."
Wired systems can pose issues for medical staff as well as parents.
"The main concern regarding wired systems is that they restrict access to the baby and often get tangled with other equipment, like IV lines," says Lamia Soghier, Medical Director of the Neonatal Intensive Care Unit at Children's National in Washington, D.C , who was also a NICU parent herself. "The nurses have to untangle the wires, which takes time, before handing the baby to the family."
I'll never forget the first time I got to hold my son without wires. It was the first time that motherhood felt manageable, and I couldn't stop myself from crying. Suddenly, anything felt possible and all the limitations from that first week of life seemed to fade away. The rise of wired-free monitoring will make some of the stressors that accompany NICU stays a thing of the past.
A map of cumulative known cases of COVID-19 in the U.S., as of June 12th, 2020.
Have you felt a bit like an armchair epidemiologist lately? Maybe you've been poring over coronavirus statistics on your county health department's website or on the pages of your local newspaper.
If the percentage of positive tests steadily stays under 8 percent, that's generally a good sign.
You're likely to find numbers and charts but little guidance about how to interpret them, let alone use them to make day-to-day decisions about pandemic safety precautions.
Enter the gurus. We asked several experts to provide guidance for laypeople about how to navigate the numbers. Here's a look at several common COVID-19 statistics along with tips about how to understand them.
Case Counts: Consider the Context
The number of confirmed COVID-19 cases in American counties is widely available. Local and state health departments should provide them online, or you can easily look them up at The New York Times' coronavirus database. However, you need to be cautious about interpreting them.
"Case counts are the obvious numbers to look at. But they're probably the hardest thing to sort out," said Dr. Jeff Martin, an epidemiologist at the University of California at San Francisco.
That's because case counts by themselves aren't a good window into how the coronavirus is affecting your community since they rely on testing. And testing itself varies widely from day to day and community to community.
"The more testing that's done, the more infections you'll pick up," explained Dr. F. Perry Wilson, a physician at Yale University. The numbers can also be thrown off when tests are limited to certain groups of people.
"If the tests are being mostly given to people with a high probability of having been infected -- for example, they have had symptoms or work in a high-risk setting -- then we expect lots of the tests to be positive. But that doesn't tell us what proportion of the general public is likely to have been infected," said Eleanor Murray, an epidemiologist at Boston University.
These Stats Are More Meaningful
According to Dr. Wilson, it's more useful to keep two other statistics in mind: the number of COVID tests that are being performed in your community and the percentage that turn up positive, showing that people have the disease. (These numbers may or may not be available locally. Check the websites of your community's health department and local news media outlets.)
If the number of people being tested is going up, but the percentage of positive tests is going down, Dr. Wilson said, that's a good sign. But if both numbers are going up – the number of people tested and the percentage of positive results – then "that's a sign that there are more infections burning in the community."
It's especially worrisome if the percentage of positive cases is growing compared to previous days or weeks, he said. According to him, that's a warning of a "high-risk situation."
Dr. George Rutherford, an epidemiologist at University of California at San Francisco, offered this tip: If the percentage of positive tests steadily stays under 8 percent, that's generally a good sign.
There's one more caveat about case counts. It takes an average of a week for someone to be infected with COVID-19, develop symptoms, and get tested, Dr. Rutherford said. It can take an additional several days for those test results to be reported to the county health department. This means that case numbers don't represent infections happening right now, but instead are a picture of the state of the pandemic more than a week ago.
Hospitalizations: Focus on Current Statistics
You should be able to find numbers about how many people in your community are currently hospitalized – or have been hospitalized – with diagnoses of COVID-19. But experts say these numbers aren't especially revealing unless you're able to see the number of new hospitalizations over time and track whether they're rising or falling. This number often isn't publicly available, however.
If new hospitalizations are increasing, "you may want to react by being more careful yourself."
And there's an important caveat: "The problem with hospitalizations is that they do lag," UC San Francisco's Dr. Martin said, since it takes time for someone to become ill enough to need to be hospitalized. "They tell you how much virus was being transmitted in your community 2 or 2.5 weeks ago."
Also, he said, people should be cautious about comparing new hospitalization rates between communities unless they're adjusted to account for the number of more-vulnerable older people.
Still, if new hospitalizations are increasing, he said, "you may want to react by being more careful yourself."
Deaths: They're an Even More Delayed Headline
Cable news networks obsessively track the number of coronavirus deaths nationwide, and death counts for every county in the country are available online. Local health departments and media websites may provide charts tracking the growth in deaths over time in your community.
But while death rates offer insight into the disease's horrific toll, they're not useful as an instant snapshot of the pandemic in your community because severely ill patients are typically sick for weeks. Instead, think of them as a delayed headline.
"These numbers don't tell you what's happening today. They tell you how much virus was being transmitted 3-4 weeks ago," Dr. Martin said.
'Reproduction Value': It May Be Revealing
You're not likely to find an available "reproduction value" for your community, but it is available for your state and may be useful.
A reproduction value, also known as R0 or R-naught, "tells us how many people on average we expect will be infected from a single case if we don't take any measures to intervene and if no one has been infected before," said Boston University's Murray.
As The New York Times explained, "R0 is messier than it might look. It is built on hard science, forensic investigation, complex mathematical models — and often a good deal of guesswork. It can vary radically from place to place and day to day, pushed up or down by local conditions and human behavior."
It may be impossible to find the R0 for your community. However, a website created by data specialists is providing updated estimates of a related number -- effective reproduction number, or Rt – for each state. (The R0 refers to how infectious the disease is in general and if precautions aren't taken. The Rt measures its infectiousness at a specific time – the "t" in Rt.) The site is at rt.live.
"The main thing to look at is whether the number is bigger than 1, meaning the outbreak is currently growing in your area, or smaller than 1, meaning the outbreak is currently decreasing in your area," Murray said. "It's also important to remember that this number depends on the prevention measures your community is taking. If the Rt is estimated to be 0.9 in your area and you are currently under lockdown, then to keep it below 1 you may need to remain under lockdown. Relaxing the lockdown could mean that Rt increases above 1 again."
"Whether they're on the upswing or downswing, no state is safe enough to ignore the precautions about mask wearing and social distancing."
Keep in mind that you can still become infected even if an outbreak in your community appears to be slowing. Low risk doesn't mean no risk.
Putting It All Together: Why the Numbers Matter
So you've reviewed COVID-19 statistics in your community. Now what?
Dr. Wilson suggests using the data to remind yourself that the coronavirus pandemic "is still out there. You need to take it seriously and continue precautions," he said. "Whether they're on the upswing or downswing, no state is safe enough to ignore the precautions about mask wearing and social distancing. 'My state is doing well, no one I know is sick, is it time to have a dinner party?' No."
He also recommends that laypeople avoid tracking COVID-19 statistics every day. "Check in once a week or twice a month to see how things are going," he suggested. "Don't stress too much. Just let it remind you to put that mask on before you get out of your car [and are around others]."
GOOD10: The Pandemic Issue explores big-picture ways that science innovation and communication can usher in a more equitable, more progress-oriented, and safer world.
This issue is a collaboration among GOOD, leapsmag, and the Aspen Institute Science & Society Program.
The GOOD10 format explores fundamental issues facing humanity through the lenses of ten forces pushing the needle toward progress: Places, Philanthropists, Celebrities, Whistleblowers, Companies, Media, Products, Politicians, Scientists, and Actions. Across these categories, we seek to present unexpected and encouraging paradigms emerging from this historic crisis.
This special issue is available as an e-reader version for both desktop and mobile. It is also available as a free downloadable PDF.
TABLE OF CONTENTS:
- PLACES:
55 Lessons Learned About Science Communication Around the World; Quarantining Our Way Into Outer Space - PLACES:
Quarantining Our Way Into Outer Space - PHILANTHROPISTS:
An Exclusive Interview with Wendy Schmidt about Science in the Pandemic Era - CELEBRITIES:
Neil deGrasse Tyson Wants Celebrities to Promote Scientists - WHISTLEBLOWERS:
The Science Sleuths Holding Fraudulent Research Accountable - COMPANIES:
The Biggest Challenge for a COVID-19 Vaccine: Making It Accessible and Affordable - MEDIA:
Isaac Asimov on the History of Infectious Disease—And How Humanity Learned To Fight Back - PRODUCTS:
Will COVID-19 Pave the Way For DIY Precision Medicine? - POLITICIANS:
Will the Pandemic Propel STEM Experts to Political Power? - SCIENTISTS:
Would a Broad-Spectrum Antiviral Drug Stop the Pandemic? - ACTIONS:
Pseudoscience is Rampant: How Not to Fall For It - ACTIONS:
How COVID-19 Could Usher In a New Age of Collective Drug Discovery
THE EVENT:
"The Pandemic Science Summit" focused on how science innovation is key to society's future stability as we emerge from the pandemic, featuring:

Christopher Bailey – Arts and Health Lead, World Health Organization

Elisabeth Bik, Ph.D. – Microbiologist and scientific integrity consultant

Margaret Hamburg, M.D. – Foreign Secretary, National Academy of Medicine; former Commissioner, U.S. Food and Drug Administration

Peggy Oti-Boateng, Ph.D. – Director, Division of Science Policy and Capacity- Building, UNESCO

George Yancopoulos, M.D., Ph.D. – President and Chief Scientific Officer, Regeneron Pharmaceuticals
Kira Peikoff was the editor-in-chief of Leaps.org from 2017 to 2021. As a journalist, her work has appeared in The New York Times, Newsweek, Nautilus, Popular Mechanics, The New York Academy of Sciences, and other outlets. She is also the author of four suspense novels that explore controversial issues arising from scientific innovation: Living Proof, No Time to Die, Die Again Tomorrow, and Mother Knows Best. Peikoff holds a B.A. in Journalism from New York University and an M.S. in Bioethics from Columbia University. She lives in New Jersey with her husband and two young sons. Follow her on Twitter @KiraPeikoff.

